Article Text

Abstract
High-throughput genomic technology has rapidly become a major tool for the study of breast cancer. Gene expression profiling has been applied to many areas of research from basic science to translational studies, with the potential to identify new targets for treatment, mechanisms of resistance and to improve on current tools for the analysis of prognosis. However, the sheer scale of the data generated along with the number of different protocols, platforms and analysis methods can make these studies difficult for clinicians to comprehend. Similarly, computational scientists and statisticians that may be called upon to analyse the data generated are often unaware of the processes involved in sample collection or the relevance and impact of genetics and pathological characteristics. There is a pressing need for better understanding of the challenges and limitations of microarray approaches, both in experimental design and data analysis. Holistic, whole-genome approaches are still relatively new and critics have been quick to highlight non-overlapping results from groups testing similar hypotheses. However, it is often subtle differences in the experimental design and technology that underpin the variation between these studies. Rather than indicating that the data are meaningless, this suggests that many findings are real, but highly context dependent. This review explores both the current state and potential of bioinformatics to bring meaning to high-throughput genomic approaches in the understanding of breast cancer.
Statistics from Altmetric.com
The breast cancer field has been quick to embrace the potential of high-throughput genomic approaches.1 The attraction of these methods is readily apparent given the opportunity to simultaneously measure variation in thousands of DNA sequences, mRNA transcripts, peptides or metabolites (fig 1) to give us a holistic view of the machinations of cellular processes. Breast cancer is an extremely complex disease, with many risk factors ranging from unavoidable genetic predisposition through to lifestyle choices such as diet and exercise.2 In addition, the breast is a difficult tissue to study, as it is composed of several cell types and undergoes structural changes during the menstrual cycle, pregnancy and ageing.2 From commonly used clinicopathologiocal characteristics (such as tumour size, lymph node involvement, subtype, grade and oestrogen receptor (ER) expression) it is clear that breast cancer is a highly heterogeneous disease. Molecular profiling has confirmed this and highlighted the underlying complexity3 ,4 ,5 and it is therefore hardly surprising that different tumours respond to different treatments.

Summary of different types of high-throughput microarray and what they measure. There are now many different types of microarray that enable the measurement of many molecular variables in a holistic, systematic fashion. CGH, comparative genomic hybridisation; ChIP-chip, chromatin immunoprecipitation microarrays; GC-M, gas chromatography mass; NMR, nuclear magnetic resonance; SAGE, serial analysis of gene expression; SNP, single nucleotide polymorphism; spec, spectrometry.
This review aims to highlight the importance of reasoned experimental design and sound statistical analysis, illustrating the many possible confounding factors and limitations that need be taken into account when considering the value of high-throughput studies. It will focus primarily on gene expression profiling, but many of the issues raised are also applicable to other “-omic” technologies, such as array CGH, miRNA and proteomics array based methods (fig 1).
Experimental design
The shift in approach from measuring the level of a single transcript or protein in a cohort of patients to simultaneously measuring the levels of thousands of genes or proteins brings with it a need to better understand the concepts of multiple testing and false discovery rates.6 With conventional approaches, the level of a single gene or protein is measured to prove or disprove a hypothesis. One of the attractions of high-throughput methods is that they are data driven rather than hypothesis driven, so are not limited by prior knowledge. While these methods can be effectively used to prove or disprove a given hypothesis, there real value is in generating new ones. A consequence of having many more features (genes, transcripts, single nucleotide polymorphisms, peptides, etc) than the number of samples is that many of the apparently differentially expressed features may be due to chance, rather than real biological differences. Considering the heterogeneous nature and variability of samples it should not be unexpected that subgroups of data do not separate into well-defined clusters in low dimensional visualisations (fig 2). For a more detailed review of issues of dataset dimensionality and multiple testing the reader is directed to the review of Clarke et al.6 Variation between gene signatures of the most changing genes can arise from differences in cohort selection (biological variables) and experimental bias (technical variables).
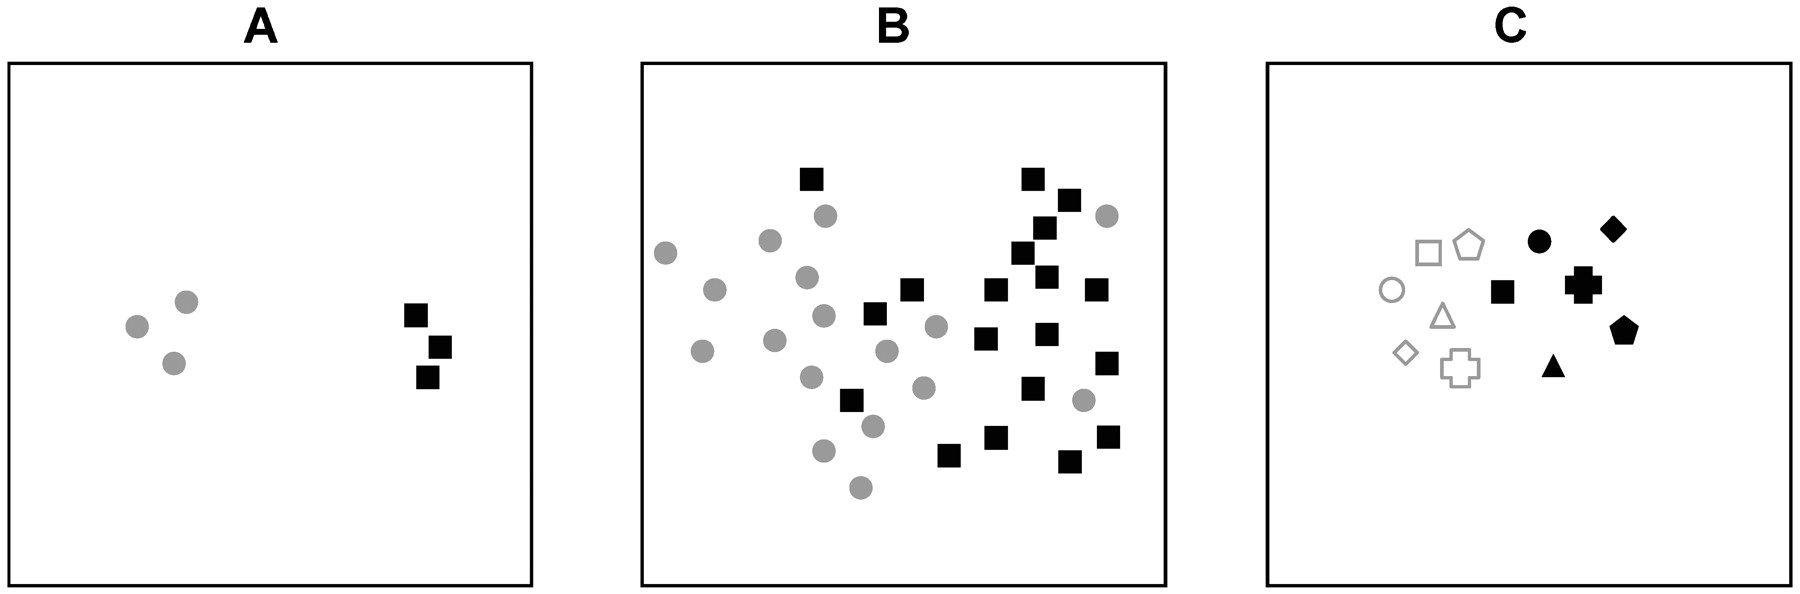
The level of variation across replicates or samples determines the numbers required to identify significantly differentially expressed genes that distinguish subgroups. The example plots represent hypothetical overall transcriptome similarity of samples by two-dimensional principle components analysis or multidimensional scaling. (A) The grey circle and black square replicates tightly cluster together, but are clearly distinct from each other. (B) The grey circles are less clearly separated from the black squares so greater numbers are required to identify consistent differences with the same level of confidence as in (A). (C) Matched samples, eg, before (filled symbols) and after (open symbols) measurements, can more easily identify common changes in expression relating to a particular treatment or procedure.
Biological variables
When the objective of a microarray experiment is to identify genes that are differentially expressed between groups of “experiment” and “control” samples it is essential that the phenotype under investigation (treatment, overexpressed gene, tumour or patient characteristic) represents the largest source of variation. If this is not the case, then the results will be compromised due to confounding factors (whether known or unknown). One way to minimise this potential problem is to make sure the two groups of samples being compared are as similar to each other as possible in every respect except the phenotype under test. An alternative approach is simply to use huge numbers of samples, increasing the likelihood that the experimental variable is the only consistent difference between the two groups. Due to the high cost of these approaches and the scarcity of samples, the former is often the only feasible approach.
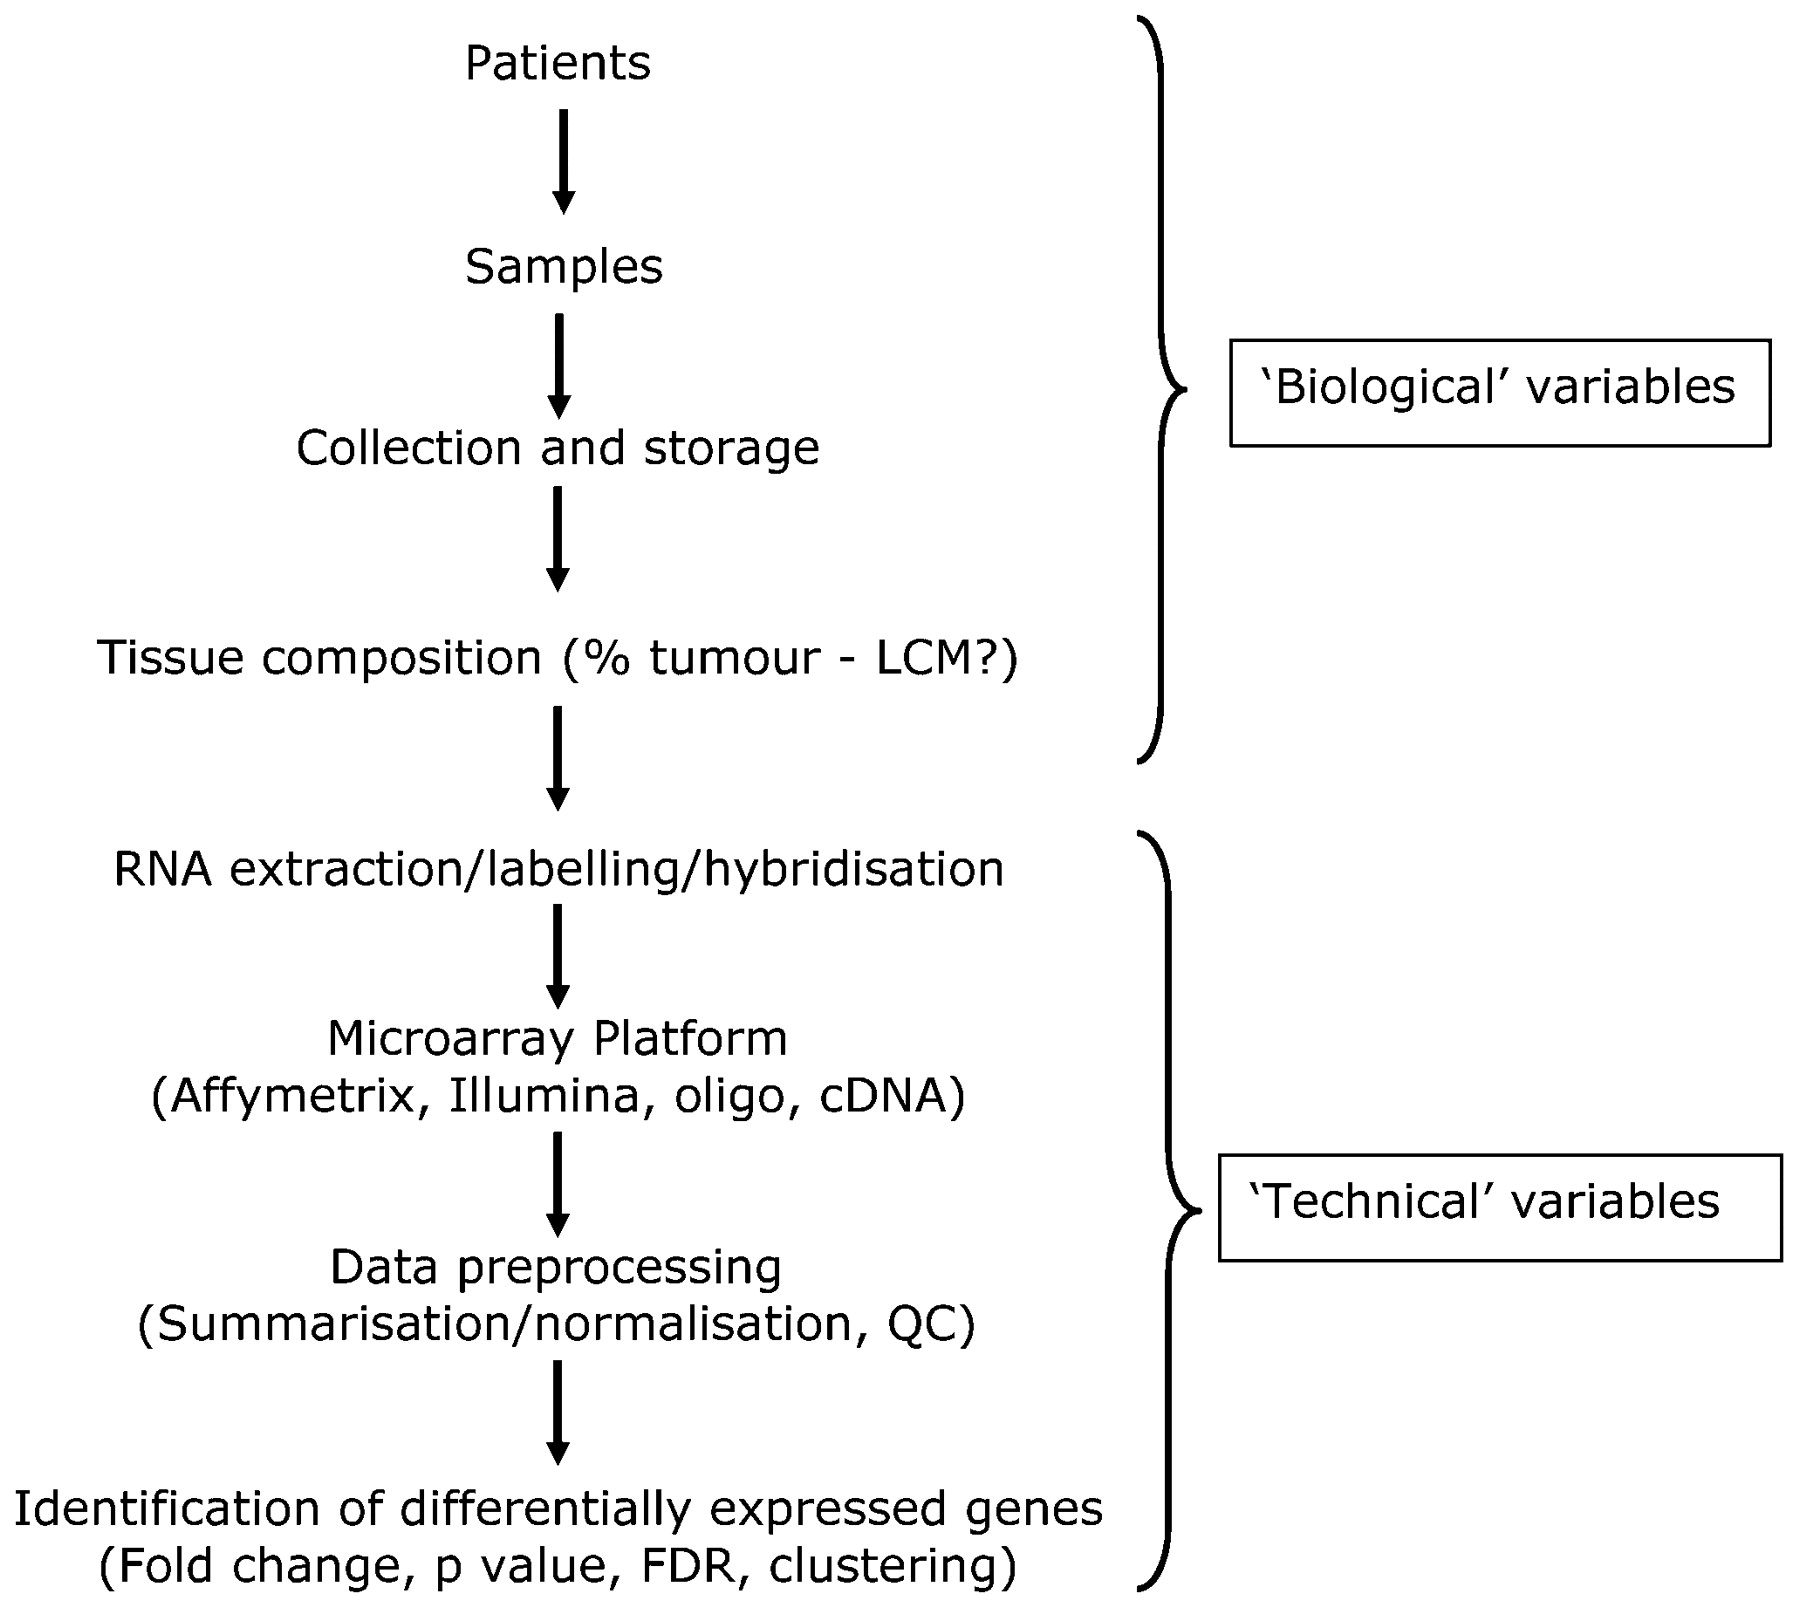
With cell line experiments it is relatively easy to minimise sources of variation by preparing samples in exactly the same way and following strict protocols to ensure that replicates are highly similar to each other. In this case, relatively few replicates are required to distinguish between the “experimental” and “control” samples (fig 2A). However with primary patient samples, molecular heterogeneity is a much bigger issue. Gene expression has been shown to be affected by so many variables that either highly specific entry criteria or large cohorts are required to distinguish between the “experimental” and “control” samples (fig 2B). An alternative approach, suited to looking for consistent changes in different individuals is to utilise “matched samples” of tumour7 or normal tissue8 taken from the same individual before and after an intervention (fig 2C). These paired studies have increased statistical power and the potential to predict which individuals will respond to the intervention. Another important consideration is the tissue composition of tumour material that is used as the starting point for extracting DNA, RNA, etc, for molecular analysis, with many studies now employing laser capture microdissection (fig 3). The need for such precision is highlighted by the reanalysis of the “normal-like” subtype described by Perou’s and Sorlie’s groups, in which histopathological examination of tumor samples categorised as “normal-like” revealed normal tissue contamination.3 ,4 ,5 ,9 ,10

Overview of key steps in a microarray experiment. Biological and technical variables are introduced at many stages, and these will all have an impact on the final results. It is important that all these steps are clearly documented. FDR, false discovery rate; LCM, laser capture microdissection; QC, quality control.
Technical variables
Although the underlying principles of annealing and hybridisation of complementary sequences are the same for all gene expression approaches, there are some fundamental differences in the design and production of the microarray platforms. Early microarrays tended to be produced in individual laboratories from PCR products from cloned cDNA or synthetic oligonucleotides printed onto glass slides.11 ,12 The technology has rapidly evolved and expanded to profile many other variables including genomic DNA mutations and copy number, methylation and microRNAs, protein antibody or tissue and cell lysates (fig 1). Availability of commercial microarrays has been facilitated by several companies including Affymetrix (Santa Clara, California, USA), Agilent Technologies (Santa Clara, California, USA) and Illumina (San Diego, California, USA) among others, improving comparison and consistency of results to some degree within studies using each particular platform.
The majority of peer-review journals have made it a prerequisite for publication that gene expression datasets are made publicly available, and this is facilitated by data repositories such as ArrayExpress13 and NCBI Gene Expression Omnibus.14 In addition to the raw data, authors have to supply details of the samples, platform and protocols used according to MIAME (Minimum Information About a Microarray Experiment) guidelines.15 The requirement to make data available has improved the transparency of microarray studies and enabled meta-analysis. However, the many steps involved in the workflow of a typical microarray experiment (fig 3) often vary between studies and this can introduce bias. Although the lack of overlap in lists of significant genes from apparently similar studies has been well documented,16 these discrepancies can usually be attributed to differences in the underlying technology such as probe sequence design or differences in the way the experiments were conducted. Nevertheless, Sorlie and coworkers9 demonstrated that breast cancer subtypes are distinguishable at the unsupervised level (see fig 4) across three different microarray platforms. Where there is variation between the most differentially expressed genes identified by each array platform, there is normally a highly significant overlap at the pathway level. It is important to remember that all microarray results are highly dependent upon the information used to design them in the first place. A re-mapping exercise of microarray probesets with the latest genome annotation revealed a 30–50% discrepancy in the genes previously identified as differentially expressed, regardless of the analysis method employed.17
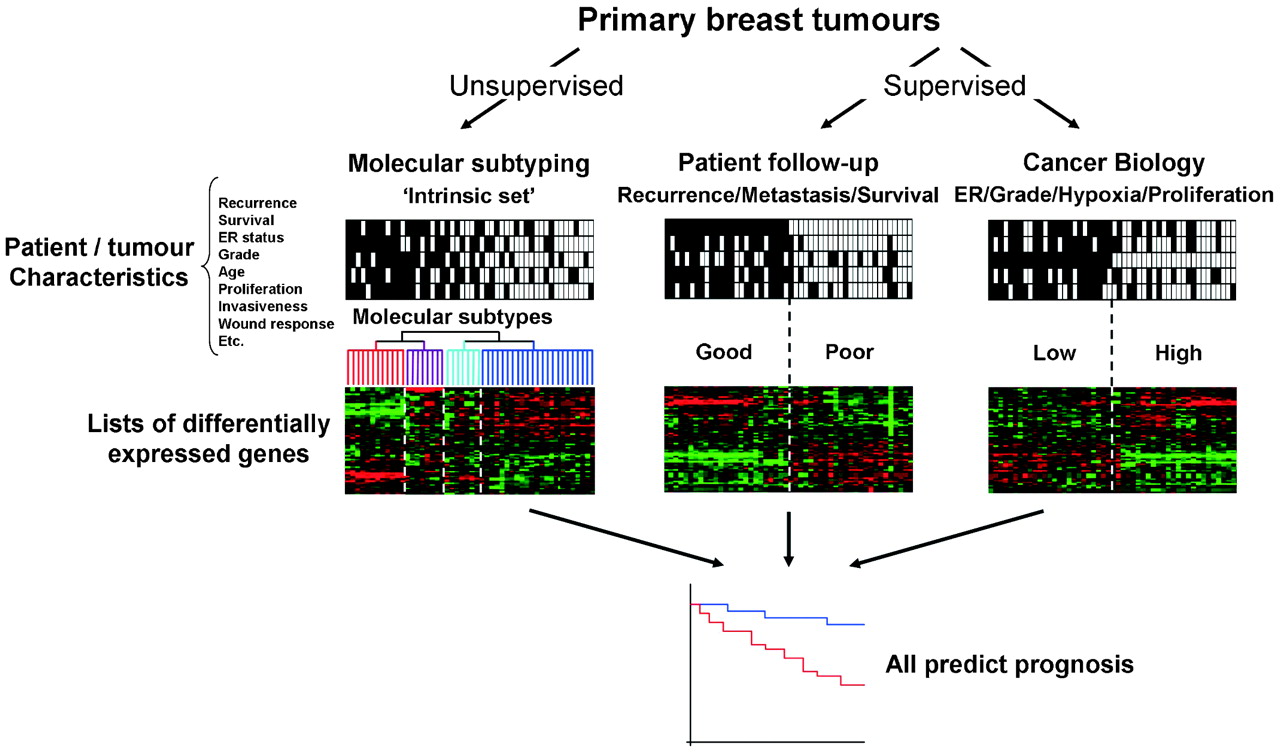
Concordance between different approaches to prognosis prediction. Regardless of the strategy used to identify lists of significantly differentially expressed each method can be used to predict prognosis. These profiles are inter-related and may be more accurate than existing single markers. ER, oestrogen receptor.
Subtyping, classification and prognosis
Breast tumours can be segregated by many methods of histopathology and molecular pathology in order to predict prognosis or responsiveness to various therapies.18 There have been three broad approaches to analysing gene expression microarrays in the breast cancer field (fig 4). The first of these is an unsupervised method of analysis, in which tumours are clustered into sub-groups by an “intrinsic” gene set that reflects differences in gene expression between tumours rather than within tumours,3 ,4 ,5 ,9 without using selection criteria. The most striking molecular differences between luminal and basal-like subtypes have repeatedly been identified and validated with different technologies and platforms.5 ,19 ,20 ,21 ,22 Identification of “molecular apocrine” tumours21 and further subdivision of the ER-negative tumours into at least five different subtypes23 has also been performed. The molecular subtypes identified are associated with significantly different clinical outcomes,4 ,10 which are likely to best respond to different treatment approaches. A phase II trial of anti-androgen therapy in ER/progesterone receptor (PR)/Her2-negative, androgen-positive tumours derived from this type of study is now underway.
The second two methods utilise supervised approaches based upon individual clinical follow-up data or characteristics of tumour biology such as ER status, grade or proliferation17 (see fig 4). The lack of overlap (three genes) between the 70-gene signature of the Amsterdam group24 ,25 (cDNA arrays) and the 76-gene signature of the Rotterdam group26 ,27 (Affymetrix oligonucleotide arrays) has been claimed as evidence that genomic approaches based upon follow-up data are unreliable. But logically, the heterogeneity demonstrated by unsupervised approaches would preclude replicate findings from two modest-sized studies of different groups of samples. The disparity between the signatures can potentially be accounted for when examining the variations in the inclusion criteria (age, lymph node status, diameter of tumour, adjuvant treatment, etc), the platform (cDNA or oligonucleotide arrays, or quantitative reverse transcription PCR (qRT-PCR)) and different data analysis methods used in each study. Despite the clear differences in approach and a lack of consensus in the gene signatures generated, all three of the broad approaches outlined above (fig 4) have a similar capacity to predict prognosis. Evaluation of several signatures with a single test dataset demonstrated a high degree of overlap in the outcome predicted for individual patients.20
Reproducibility, validation and dataset-specific bias
The genes that make up a gene expression signature are by their nature dependent upon: patient and tumour characteristics, array platform, normalisation method, and statistical thresholds for gene selection or the classification algorithm employed (fig 3). Using a particular dataset to generate a predictive profile has its own inherent bias based upon its attributes. Ein-Dor et al demonstrated that many different but equally predictive lists of 70 genes can be produced simply by changing the members of “training” and “test” sets.28 It seems inevitable that gene signatures will perform less well with validation datasets than the ones used to generate the profile. A follow-up study to the 76-gene Rotterdam signature identified strong time dependence of the signature when validated with a cohort with longer median follow-up time (14 years) compared with the original study (8 years).26 Many patient characteristics are known to affect gene expression (and other tumour features), including age29 and race.30 Anders et al demonstrated that breast cancer arising in younger women was more likely to involve PI3K, Myc and β-catenin, whereas the activation of Src and E2F deregulation was more associated with tumours in older women31 Only genes that are clearly mechanistically different between particular groups of patients will be identified reproducibly between similarly defined cohorts.
Using a series of repeated validation datasets comparing breast cancer and normal breast cell lines (MCF7 and MCF10A), we recently examined the variability between datasets generated using different amounts of starting RNA, alternative protocols, different generations of Affymetrix GeneChip or scanning hardware. We demonstrated that systematic, multiplicative biases are introduced at the RNA, hybridisation and image-capture stages of a microarray experiment.32
Data integration and meta-analysis
Validation of new results with independent data is essential to establish that research findings are indeed “real”. For example, meta-analyses of multiple experiments using different platforms has resulted in new predictive signatures that perform as well or better than the platform specific signature.33 ,34 These approaches remove the inherent bias of a single microarray platform and are able to concentrate on genes that are consistently differentially expressed, regardless of the technology used. However, cross platform meta-analyses may be somewhat limited by the number of common genes represented. Cross platform normalisation35 and distance weighted discrimination36 methods have been put forward for comparing data from different types of microarrays.
One way to overcome the heterogeneity described above is to increase the size of studies by combining datasets; however this can make the problem of analysing the data even more daunting. The many breast cancer gene expression datasets now in the public domain represent a valuable resource for meta-analysis. However, dataset-specific bias precludes integration of published studies at the raw intensity level without some form of correction method (fig 5). In our study, simple batch mean-centring was sufficient to reconcile validation cell line and published breast tumour datasets, outperforming distance-weighted discrimination36 and generating similar results to ComBat, an empirical Bayes method to adjust for batch effects.37 Several meta-analysis studies have now been published, generally validating previous findings, emphasising “real” effects, consensus and improving clarity.34 ,38 ,39 ,40 ,41

Dataset-specific bias must be removed for integration of gene expression data.32 Combining breast tumour gene expression profiles generated by two published studies. (A) Before mean batch-centering. (B) After mean batch-centering. Hierarchical clustering of tumours based upon 640 probesets representing Sorlie et al5 “intrinsic” genes. Thumbnails show all 640 probesets. (i) Tumours classified by Richardson et al22: red, basal-like; blue, non-basal like, pink, BRCA1; tumours classified by Farmer et al21: red, basal; blue, luminal; green, apocrine. Clusters of genes associated with the “Sorlie subtypes” are highlighted as follows: (ii) ERBB2 gene cluster, (iii) luminal A gene cluster, (iv) basal gene cluster. (v) Centroid prediction was used to assign the tumours to the five Norway/Stanford subtypes: basal (red), luminal A (dark blue), luminal B (light blue), ERBB2 (purple), normal-like (green), unassigned (grey).
We recently demonstrated that integrating up to six published breast cancer Affymetrix GeneChip datasets can increase the accuracy of prognosis prediction and that this can be improved further by removing systematic, multiplicative bias.32 The most accurate prognosis predictions are generated when the test sets closely share the patient and tumour characteristics of the training sets. An alternative approach to building ever larger combined datasets representing the whole breast cancer population would be to concentrate on generating gene expression classifiers for separate clearly defined groups of patients based on commonly used clinicopathological parameters. However, strict entry criteria would severely restrict the number of suitable patients/tumours eligible for inclusion and this approach could take no account of possible unknown confounding factors. In clinical practice, single sample predictors10 are required, applicable to large groups of patients and our work strongly suggests that these will be best generated from the largest possible cohorts (or integrated datasets). It is essential that researchers are aware that differences in dataset composition can also have dramatic effects on meta-analysis and it may not always be appropriate to combine datasets if they have been subject to different entry criteria or treatments.32
Will high-throughput approaches make it to the clinic?
Clinicians have to chose the most appropriate treatment for individuals; however many of the disease parameters currently used are qualitative rather than quantitative. Prognostic models such as The International Consensus Guidelines of St Gallen42 and the Nottingham Prognostic Index43 are used to guide treatment decisions. While these models may be able to predict proportions of the population in which an outcome may occur with reasonable accuracy, they cannot identify in which women the outcome will occur; the inevitable consequence of this is either overtreatment or inadequate treatment. Following the National Comprehensive Cancer Network guidelines can result in unnecessary chemotherapy for up to 80% of some of the better prognosis subgroups. For molecular signatures to have any true value in treatment selection they must be reliably validated to outperform or add value to existing clinical guidelines.1 Traditional classifications of tumours may provide clear-cut treatment options in high-risk and low-risk cases, but often tumours fall into an “intermediate” group; it is in these borderline cases where improvements are most urgently required. In these cases the “safe” option is to overtreat, benefiting a relatively small minority of cases and exposing the rest to side effects unnecessarily. Conversely, a more conservative approach may avoid unwarranted treatment and additionally reduce costs, but some women that would benefit may go untreated. Studies that examine links between gene expression and known prognostic factors such as grade44 and ER status45 may be beneficial for this intermediate group.
Two clinical tests based upon gene expression profiling studies are already commercially available and being evaluated in large multicentre, multinational trials. The TAILORx study, sponsored by the National Cancer Institute, will test OncotypeDX,46 a 21-gene qRT-PCR recurrence score algorithm (derived from gene expression array studies) that can be performed on formalin-fixed, paraffin-embedded tissue. The study will enrol more than 10 000 women with hormone-positive (ER positive and/or PR positive), ERBB2-ngative and node-negative breast cancer to determine which women should receive adjuvant chemotherapy in addition to hormone therapy. In a study of archival material from 4964 lymph-node-negative breast tumours that were not treated with chemotherapy, the Recurrence Score was strongly associated with risk of breast cancer death among ER-positive, tamoxifen-treated and untreated patients.47 In the B-20 study, recurrence score not only quantified the likelihood of breast cancer recurrence in women with node-negative, ER-positive breast cancer, but also predicted the magnitude of chemotherapy benefit.48 However, in a study of 149 patients who were not treated with adjuvant therapy, the 21 gene-based recurrence score was not predictive of distant disease recurrence, highlighting the importance of cohort selection.49 OncotypeDX has been added to the list of approved American Society of Clinical Oncology markers50 and it is anticipated that 60 000 OncotypeDX tests will be performed in 2008. With tests costing thousands of dollars this could have implications for health service providers, although this would be set against reducing the cost of unnecessary treatment.1 The US Food and Drug Administration has approved the Mammaprint clinical test that was developed by Agendia (Huntington Beach, California, USA) from the 70-gene signature.25 While the assay has been validated by this group,24 ,51 concerns regarding the design and statistical analysis used to derive the original 70-gene signature have been raised28 ,52 These issues have largely been incorporated into the prospective MINDACT (Microarray in Node-Negative Disease May Avoid Chemotherapy) clinical trial of 6000 patients.53 ,54 The TRANSBIG consortium also used the same 70-gene validation samples to evaluate two other gene expression signatures with potential prognostic value that were developed, using the Affymetrix microarray platform: the 76-gene Veridex/Rotterdam signature27 ,55 and the Genomic Grading Index.44 This retrospective validation was recently published,26 concluding that the three signatures performed in a similar way, all being superior to the classical clinicopathological methods.
Take-home messages
High-throughput genomic approaches have the potential to significantly improve our understanding of breast cancer.
Breast cancer is a highly heterogeneous disease and many biological variables can affect the data generated, so careful experimental design is required for meaningful results.
There are many different protocols and analysis methods; understanding which is most appropriate is a considerable challenge.
Results need to be demonstrated to be statistically robust, combining datasets and performing meta-analyses can help us to identify consensus findings.
One consequence of moving towards “individualised treatment” is that it can be difficult to identify appropriate numbers of patients with similar characteristics that have been exposed to the same treatment regimen to adequately statistically power a study. While high-throughput expression profiling methods are not yet fully evaluated, they clearly have great potential that needs to be carefully validated before they become standard prognostic tools. In the meantime, they are generating a large amount of valuable data that are gradually improving our understanding of the molecular changes that are associated with breast cancer development, progression and treatment.
Conclusions
Issues of cohort selection and choice of appropriate analysis methods are central to breast cancer studies using high-throughput genomic approaches. Ultimately, bioinformatics seeks to bring meaning to biological data so that it can be comprehended in the context of current knowledge, allowing new hypotheses to be generated and tested.
Acknowledgments
AHS is very grateful for funding from Breakthrough Breast Cancer.
REFERENCES
Footnotes
Competing interests None.