Article Text

Abstract
Background For the clinical management of adrenocortical neoplasms it is crucial to correctly distinguish between benign and malignant tumours. Even histomorphologically based scoring systems do not allow precise separation in single lesions, thus novel parameters are desired which offer a more accurate differentiation. The tremendous potential of microRNAs (miRNAs) as diagnostic biomarkers in surgical pathology has recently been shown in a broad variety of tumours.
Methods In order to elucidate the diagnostic impact of miRNA expression in adrenocortical neoplasms, a cohort of 20 adrenocortical specimens including normal adrenal tissue (n=4), adrenocortical adenomas (ACAs) (n=9), adrenocortical carcinomas (ACCs) (n=4) and metastases (n=3) was analysed using TaqMan low density arrays to identify specific miRNA profiles in order to distinguish between benign and malignant adrenocortical lesions. Results were validated in a validation cohort (n=16).
Results Concerning the differential diagnosis of ACAs and ACCs, 159 out of 667 miRNAs were up- and 89 were down-regulated in ACAs. Using real-time PCR analysis of three of the most significantly expressed single key miRNAs allowed separation of ACAs from ACCs. ACCs exhibited significantly lower levels of miR-139-3p (up to 8.49-fold, p<0.001), miR-675 (up to 23.25-fold, p<0.001) and miR-335 (up to 5.25-fold, p<0.001). A validation cohort of 16 specimen with known Weiss score showed up-regulation of miR-335 and miR-675 in the majority of cases with probable malignant course, although overlapping values exist.
Conclusion miRNA profiling of miR-675 and miR-335 helps in discriminating ACCs from ACAs. miRNA analysis may indicate malignant behaviour in cases with indeterminate malignant potential.
- miRNA
- adrenal gland
- adrenocortical cancer
- miRNA array
- micro array
- molecular pathology
This is an open-access article distributed under the terms of the Creative Commons Attribution Non-commercial License, which permits use, distribution, and reproduction in any medium, provided the original work is properly cited, the use is non commercial and is otherwise in compliance with the license. See: http://creativecommons.org/licenses/by-nc/2.0/ and http://creativecommons.org/licenses/by-nc/2.0/legalcode.
Statistics from Altmetric.com
Introduction
MicroRNAs (miRNAs) are a class of recently discovered small RNA molecules that regulate the expression of genes at the translational level.1 2 The understanding of these tiny RNA molecules is rather limited, but studies indicate that miRNA-mediated gene regulation is likely to play key roles in human development, cellular differentiation and oncogenesis. MiRNAs are endogenously expressed short non-coding RNAs with 18–25 nucleotides in length capable of repressing protein translation through binding to target messenger RNA (mRNA). The single stranded miRNAs, derived from miRNA duplex complexes, can associate with the RNA-induced silencing complex (RISC)3 and cause the translational repression or cleavage of these target mRNA sequences.
The discovery of the first miRNAs in 1993 immediately stimulated research in the medical field, and the question arose as to what extent miRNA analysis may be utilised in surgical pathology. Recent research indicated that evaluation of miRNA expression levels may substantially contribute to the understanding of cancer development, progression and treatment.4 Analysis of miRNA up- and down-regulation has been shown to be useful to support the diagnosis in a broad variety of lesions including, for example, endocrine tumours from the thyroid gland.5–10
Recently Giordano et al described a set of miRNAs related to prognosis in adrenocortical carcinoma (ACC).11 Whereas the discrimination of normal adrenal tissue and adrenocortical adenoma (ACA) is usually not challenging to the pathologist, the differential diagnosis of adrenocortical adenoma from ACC is notoriously difficult. ACC is a rare tumour which accounts for less than 0.2% of all human malignancies. Up to two-thirds of cases have distant metastases at the time of diagnosis, and the mortality exceeds 90% with a mean survival of less than 30 months.12 13 Unlike in other malignancies, the diagnosis of ACC cannot be based on simple morphological parameters. To overcome the problem, distinct sets of histopathological criteria for the discrimination of benign and malignant adrenocortical neoplasm have been proposed.12 14 15 Nevertheless a clear separation of these neoplasms remains impossible unless the patient develops metastases. This is mainly due to the fact that such scores are based on histomorphological features that are likely to suffer from interobserver variation.
Little is currently known about the microRNA expression profile in adrenocortical tumours. In a very recent paper several miRNAs are described to be of diagnostic as well as prognostic value in ACAs and ACCs,16 indicating the potential value of microRNA expression patterns in diagnostic pathology. In order to further investigate the miRNA expression profiles in adrenal tissue, we performed miRNA analyses on a series of normal, benign and malignant adrenocortical tissue to analyse 667 human miRNA, followed by real-time PCR based validation of miRNA expression of single key miRNAs with potential diagnostic value in discriminating ACC from ACA. In a third step we compared miRNA expression levels of key miRNAs with the Weiss score in a validation cohort.
Material and methods
Patient material
Formaldehyde-fixed paraffin-embedded tissue collection samples examined in the years from 2001 to 2008 were retrieved from the files of the Institute of Pathology and Neuropathology, University Hospital of Essen, University of Duisburg-Essen, German. All cases selected were operated and seen for follow-up at the Department of Surgery and Centre of Minimally Invasive Surgery, Kliniken Essen-Mitte, Essen, Germany and the Department of Transplantation and General Surgery, University Hospital Essen, Essen, Germany. The test cohort comprised normal adrenocortical tissue (n=4) taken from nephrectomy specimens, ACAs associated with Cushing syndrome (n=5) and associated with Conn syndrome (n=4), ACCs (n=4) and tissue from metastases of ACCs (n=3). The validation cohort comprised 15 primary adrenocortical lesions and one lung metastasis, all scored according to the criteria of Weiss et al.15 The tumours for this study were reviewed by KJS. Tumour classification was performed according to the current WHO classification (2004).13 All ACC cases of the test study demonstrated at least three criteria associated with malignancy, for example necrosis, capsular invasion, vascular invasion, increased mitotic activity, significant atypia and/or metastases according the criteria proposed by Weiss et al.15 Table 1 summarises clinicopathological data of all ACCs.
Clinicopathological data of the four adrenocortical carcinomas in the test cohort
Tissue was retrieved from paraffin-embedded material using a punch tool of 0.6 mm diameter. At least three complete cores were used for RNA extraction. Standard H&E staining was performed in order to ensure that removed tissue samples were representative for the lesion.
RNA preparation
miRNA was prepared with the Recover All Total Nucleic Acid Isolation Kit (Applied Biosystems, Darmstadt, Germany) according to the kit protocol. In brief, tissue cylinders were deparaffinised by xylene–ethanol extraction and subsequently digested with proteinase K. Nucleic acids were bound to the silica matrix of mini spin columns, washed, DNAse digested and finally eluted with a volume of 60 μl elution buffer.
Reverse transcription
miRNAs were reverse transcribed with the TaqMan miRNA Reverse Transcription Kit (Applied Biosystems, Darmstadt, Germany), using 60 ng total RNA and pools of miRNA specific stemloop primers (Megaplex RT-Primers Pool A and B, Applied Biosystems). After reverse transcription, the cDNA was preamplified with Megaplex PreAmp Primers (Pool A and B) according to the recommendations of the supplier (Applied Biosystems).
TaqMan low density arrays
miRNA analyses were performed using TaqMan MicroRNA Array v2.0 (Applied Biosystems). Each sample was assayed with an A & B card resulting in the analysis of a total of 667 miRNA. Each miRNA was measured in duplicate.
Real-time PCR validation of single miRNAs
Key miRNAs from TaqMan low density arrays (TLDAs) were selected for validation using real-time PCR. RNA from the previous TLDAs was used to quantify miRNA levels of hsa-miR-335-4395296, hsa-miR-139-3p-4395424 and hsa-miR-675-4395. RNU48 served as endogenous control for normalisation. MiRNA levels were compared with that of the normal adrenocortical tissue. Quantitative reverse transcriptase PCR was done for each sample in triplicate. The 12 μl real-time PCR mixture contained 5.25 μl cDNA (diluted 1:25), TaqMan Universal PCR master mix (No AmpErase UNG) and 1 μl of TaqMan assay hsa-mir-675/hsa-miR-335/hsa-miR-139-3p. The reaction was imitated at 95°C for 10 min, followed by 40 cycles of 95°C for 15 s, and 60°C for 1 min. The reaction was carried out using an Applied Biosystem 7500 fast real-time PCR system (Applied Biosystems).
miRNA target prediction
The DIANA-microT algorithm was used to predict possible target genes of differentially expressed miRNAs.17 MicroT identifies miRNA targets by combining TargetScan and PicTar predictions and has been reported to be the most selective algorithm in a comparative study.18
Statistical analysis
TaqMan low density arrays
Data obtained by the TLDAs was analysed using the StatMiner 3.0 software (Integromics, Madrid, Spain). Possible outliers in each biological group were identified by correlation heatmaps, and samples with a Pearson index >0.85 were discarded from further analyses. The imputation was performed using the aggregation method ‘median’ and the experimental factor ‘biological group’. Detection thresholds were set to 35 and the best fitting endogenous control (RNU48-4373383 and MammU6-4395470) was calculated with the Normfinder algorithm. A parameter t-test (Limma) was applied for the relative quantification.
Real-time PCR
Default threshold settings were used to determine the threshold cycle data. The relative amount of each miRNA was calculated using the comparative threshold (Ct) method with ∆Ct=Ct(miRNA)−Ct(RNU48). Relative quantification of miRNA expression was calculated with the 2−∆∆Ct method (Applied Biosystems User Bulletin No. 2 (P/N:4303859)). This method (called the comparative CT method) is widely used to present relative gene expression.19 Differences between miRNA expression levels among two groups were evaluated using a t-test; p-values <0.05 were considered significant. Statistics were performed with SPSS V.17.
Results
Test cohort
TLDA analysis
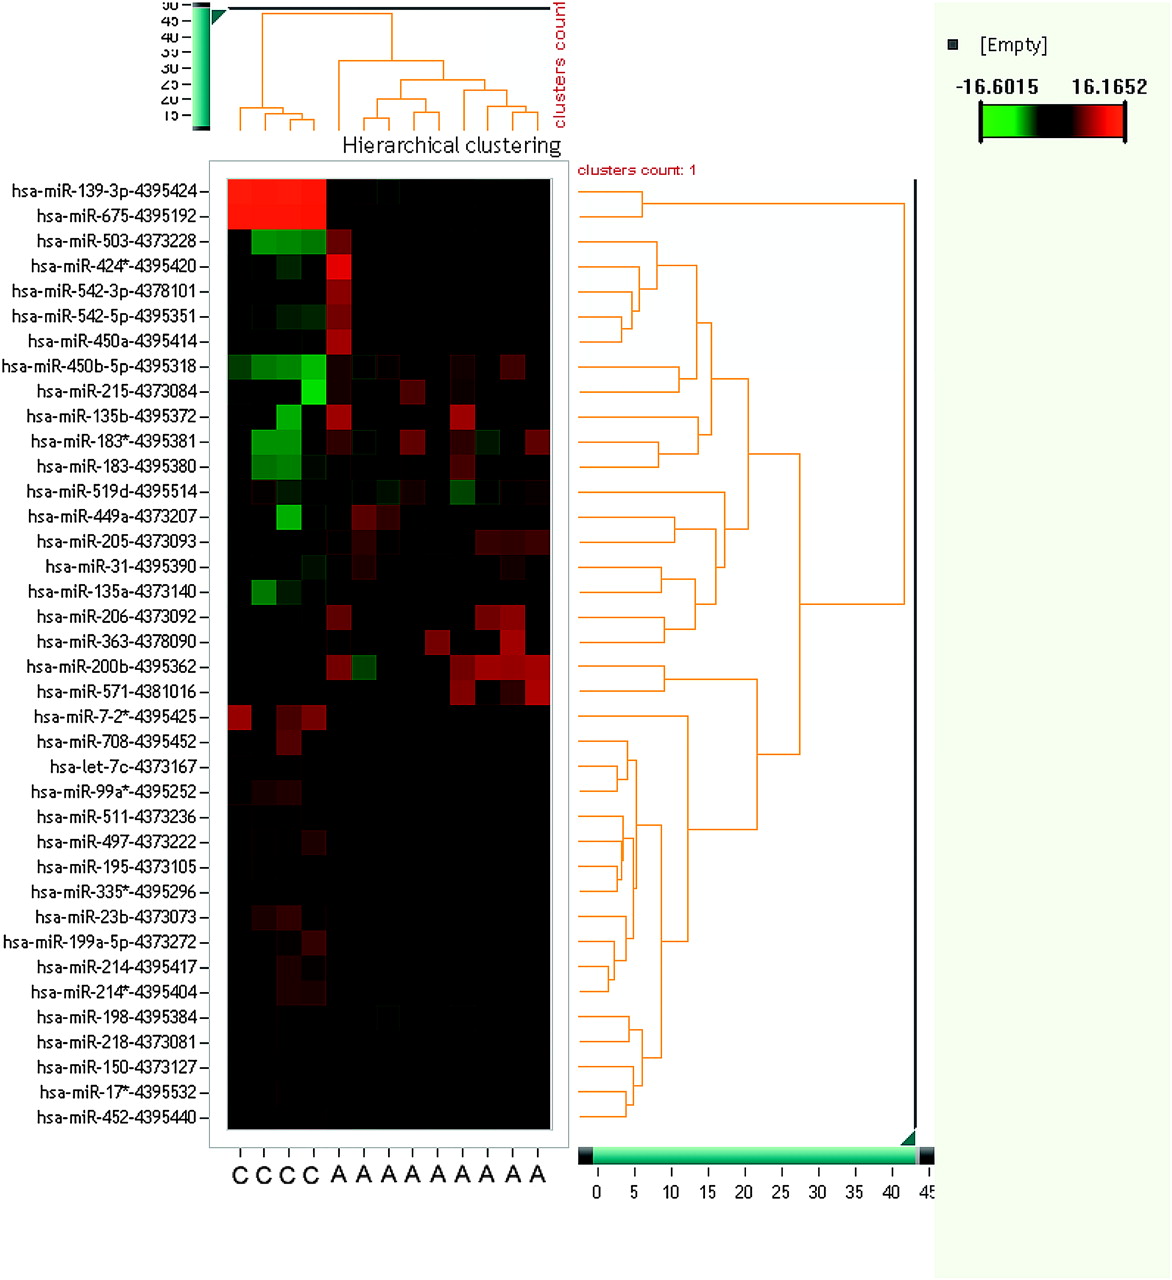
For this study a microarray technique with 667 miRNAs was used to identify significantly (p<0.05) up- or down-regulated miRNAs in normal adrenocortical tissue, ACA with Conn or Cushing syndrome, as well as ACCs and tissue from ACC metastases. In the groups of ACCs and ACAs, several miRNAs with differential expression were identified. Figure 1 shows a series of miRNAs identified as possibly useful for discriminating ACC from ACA.

Unsupervised hierarchical cluster of microRNAs (miRNAs) and adrenocortical carcinoma (ACC) and adrenocortical adenoma (ACA) samples. Each row shows an miRNA, each column shows a sample. The miRNA tree is on the right, the sample tree is on top. The cluster shows miRNAs which separate ACCs from ACAs. The colour scale at the upper right illustrates the ΔΔCt values of an miRNA across ACC and ACA samples: red for a negative ΔΔCt value and green for a positive ΔΔCt value. The clustering is done on ΔΔCt values, which passed all filtering criteria across all samples. C, adrenocortical carcinoma; A, adrenocortical adenoma.
Normal adrenocortical tissue versus ACA associated with Cushing syndrome
miRNA expression profiling showed 146 miRNAs to be significantly up-regulated and 17 miRNAs to be down-regulated in ACAs associated (online supplement).
Normal adrenocortical tissue versus ACA associated with Conn syndrome
miRNA expression profiling showed nine miRNAs to be significantly up-regulated and 47 miRNAs to be down-regulated (online supplement).
Normal adrenocortical tissue versus ACC
MiRNA expression profiling showed 74 miRNAs to be significantly up-regulated and 62 miRNAs to be down-regulated (online supplement).
Normal adrenocortical tissue versus tissue from ACC metastases
miRNA expression profiling showed 140 miRNAs to be significantly up-regulated and 22 miRNAs to be down-regulated (online supplement).
ACA (Conn syndrome) versus ACC
miRNA expression profiling showed 38 miRNAs to be significantly up-regulated and 89 miRNAs to be down-regulated (online supplement).
Adrenocortical adenoma (Cushing syndrome) versus adrenocortical carcinoma
MiRNA expression profiling showed 159 miRNAs to be significantly up-regulated and 35 miRNAs to be down-regulated (online supplement).
Quantitative reverse transcriptase PCR validation of miRNAs
Due to the large amount of significantly differentially expressed miRNAs, three key miRNAs were selected for further validation by quantitative reverse transcriptase PCR: miRNA hsa-miR-139-3p-4395424, hsa-miR-675-4395192 and hsa-miR-335*-4395296. High values of relative threshold cycles indicate low miRNA quantity, and data were normalised to RNU48 expression. Data from miRNA expression levels of one case with metastatic tissue was beyond the expected range. Although the amplification curve suggested an insufficient RNU48 control in this particular experiment, we did not delete this data from further statistical analysis.
Expression levels of miR-675
The lowest level of miR-675 was found in the group of ACCs (10.76, SD 0.63), followed by metastatic tissue (9.43, SD 16.4), ACAs associated with Conn syndrome (7.28, SD 1.31), normal adrenocortical tissue (0.622, SD 0.49), and ACAs associated with Cushing syndrome (5.71, 1.08). In the subgroup of ACCs and ACAs, miR-675 expression of ACCs was distinctly different from that of ACAs with a down-regulation of miR-675 in ACCs of up to 20.42-fold. Compared to normal adrenal tissue, we found down-regulation of miR-675 in ACCs up to 23.25-fold. Tables 2 and 3 present data on miR-675 expression levels. Figure 2 shows the distribution of expression levels among the different subgroups.
Expression levels of hsa-miR-139-3p-4395424, hsa-miR-675-4395192 and hsa-miR-335*-4395296 in normal, benign and malignant adrenocortical lesions
Differential expression of hsa-miR-139-39, hsa-miR-675 and hsa-miR-335 in normal adrenocortical tissue, adrenocortical adenomas and adrenocortical carcinomas as well as metastasis

(A) Expression levels of hsa-miR-139-3p-4395424 in normal, benign and malignant adrenocortical lesions. Data derived from quantitative real-time PCR and presented in ∆CT of relative threshold cycles indicating fold changes over normal adrenal tissue. Low values indicate high levels of miRNA. (B) Expression levels of hsa-miR-675-4395192 in normal, benign and malignant adrenocortical lesions. Data derived from quantitative real-time PCR and presented in ∆CT of relative threshold cycles indicating fold changes over normal adrenal tissue. Low values indicate high levels of miRNA. (C) Expression levels of hsa-miR-335*-4395296 in normal, benign and malignant adrenocortical lesions. Data derived from quantitative real-time PCR and presented in ∆CT of relative threshold cycles indicating fold changes over normal adrenal tissue. Low values indicate high levels of miRNA.
Expression levels of miR-139-3p
The lowest level of miR-139-3p was found in the group of ACCs (10.19, SD 0.56), followed by metastatic tissue (9.56, SD 1.92), normal adrenocortical tissue (7.10, SD 0.43), ACAs associated with Conn syndrome (6.98, SD 0.87), and ACAs associated with Cushing syndrome (6.19, 1.35). In the subgroup of ACCs and ACAs, miR-139-3p expression of ACCs was distinctly different from that of ACAs with a down-regulation of miR-139-3p in ACCs of up to 8.49-fold. Compared to normal adrenal tissue, we found down-regulation of miR-139-3p in ACCs up to 11.34-fold. Tables 2 and 3 present data on miR-139-3p expression levels. Figure 2 shows the distribution of expression levels among the different subgroups.
Expression levels of miR-335
The lowest level of miR-335 was found in the group of metastatic tissue (7.87, SD 2.25), followed by ACCs (7.44, SD 0.54), ACAs associated with Conn syndrome (5.73, SD 0.30), normal adrenocortical tissue (5.05, SD 0.45), and ACAs associated with Cushing syndrome (4.71, 0.79). In the subgroup of ACCs and ACAs, miR-335 expression of ACCs was distinctly different from that of ACAs, with a down-regulation of miR-335 in ACCs of up to 4.85-fold. Compared to normal adrenal tissue, we found down-regulation of miR-335 in ACCs up to 5.25-fold. Tables 2 and 3 present data on miR-335 and miR-675 expression levels. Figure 2 shows the distribution of expression levels among the different subgroups.
Validation cohort
The three key miRNAs, hsa-miR-139-3p-4395424, hsa-miR-675-4395192 and hsa-miR-335*-4395296, were selected for further validation by quantitative reverse transcriptase PCR in a validation cohort of 15 primary adrenocortical lesions, all scored according the Weiss score and one lung metastasis. Table 4 presents relevant clinicopathological data. Cases were sorted according to increasing Weiss scores. The cut-off values of the different miRNAs indicating a malignant behaviour were derived from the test cohort and are as followed: miRNA 335, >6; miRNA 139, >9; miRNA 675, >8.8.
miRNA expression values in the validation cohort
miRNA-335
Regarding the expression levels of miRNA-335, all cases classified as benign with a Weiss score of 0 showed values below the cut-off of 6. Among the lesions with uncertain biological behaviour (Weiss score 1–2), one case exhibited an expression level above the cut-off. Lesions with a Weiss score of 3 to 5 revealed in three of five cases increased expression levels above the cut-off value.
miRNA-139-3p
The expression levels of miRNA-139 in cases classified as benign (Weiss score=0) were lower than the cut-off value in five cases. One case exhibited increased expression levels. Among the five lesions with uncertain biological behaviour (Weiss score 1–2) the cut-off value was not reached. All lesions with a Weiss score of 3 to 5 lacked increased expression values. In one case data was not available.
miRNA-675
All adrenocortical tumours with a Weiss score of 0 showed low expression levels, not reaching above the cut-off value. One of the lesions with uncertain behaviour (Weiss score 1) exhibited values above the cut-off level. Of the five lesions with marked increased Weiss scores including the metastasis, two specimens showed expression levels above the cut off-level. Except for one case, all specimens showed increased expression levels nearly reaching the cut-off value.
Discussion
The differential diagnosis of ACA from ACA is classically based on a set of clinical and pathomorphological parameters. However, taken alone, none of these parameters is sufficient to prove malignant behaviour. To overcome the problem, differing scoring systems have been developed which are without exception rather complicated, time consuming and difficult to reproduce.20 21 Therefore novel markers allowing a more reliable separation of benign from malignant adrenocortical lesions are desirable. Molecular techniques such as miRNA analysis possess significant diagnostic potential.22
miRNA arrays can be used to differentiate different types of tissue such as non-neoplastic pancreatic tissue from human pancreatic adenocarcinoma23 or non-neoplastic prostatic tissue from prostatic adenocarcinoma.24 In addition, various studies have been successful in correlating miRNA expression levels with survival time in different cancer types, such as pancreatic carcinoma24 25 and colorectal cancer.26 A previous study of our group found miRNA expression analysis to be helpful for the differential diagnosis of various types of polyps of the colorectum.27 In endocrine pathology, miRNA analysis has been established as a useful tool in thyroid tumour pathology. Using specific sets of miRNAs, various benign and malignant tumour entities can be associated with characteristic up- or down-regulation patterns.5–10
Concerning adrenocortical pathology, a study on 22 ACAs and 33 ACCs using DNA array analysis managed to accurately classify benign and malignant tumours and offered novel prognostic information derived from gene expression patterns.11 Very recently, Soon et al9 published a study on 22 ACAs and 27 ACCs, suggesting the diagnostic and prognostic value of even single miRNAs. miRNA analysis thus seems to facilitate separation of adrenocortical neoplasm.
In this study we analysed 667 miRNAs in order to further strengthen the foundation for the miRNA based classification and differentiation of normal adrenocortical tissue, ACAs, ACCs and ACC metastasis. In a second step we validated expression data of three highly significantly altered single key miRNAs using real-time PCR. A third step was conducted with a validation cohort in order to confirm the results. The present study was performed with paraffin-embedded tissue which was recently shown to be suitable for miRNA arrays.28 Our study reveals up to 146 statistically significantly differentially expressed miRNAs in the various subgroups analysed. Thus this study confirms the power of molecular profiling as a novel diagnostic tool for the diagnosis of adrenocortical tumours. Our results show that TLDA based assessment can assist in separating malignant from benign lesions. Due to the huge amount of differentially expressed miRNAs, we focused on three single key miRNAs with the most significantly differential expression: miRNA 139-3p, miRNA 675 and miRNA 335. Each of these miRNAs allowed separation of ACCs from ACAs in the test cohort. We observed distinctly different miRNA expression levels, with up to 23.25-fold down-regulation of miR-675 in ACC compared to normal adrenocortical tissue and up to 20.42-fold down-regulation of miR-675 in ACC compared to ACA. Our results are in accordance with those of Soon et al,16 who found 23 miRNAs to be differentially expressed between ACA and ACC. Among these are miRNA 335 and miRNA195, which our study also identified as diagnostically valuable miRNAs.
We were aware that the test cohort needed further confirmation using a validation cohort. The validation cohort consisted of adrenocortical tumours with known Weiss score, including six benign tumours without any histopathological criteria proposed by Weiss (score 0). In fact, none of the three selected miRNAs correlated directly with the Weiss score. However, miRNA-335 and miRNA-675 show a potential diagnostic value in predicting the biological behaviour of adrenocortical tumours. In the subgroup containing cases with a marked increased Weiss score (score ≥3) or histologically proven metastasis, miRNA-335 and miRNA-675 levels were up-regulated in three of five and in three of five adrenocortical tumours, respectively. In contrast, miRNA-139 did not prove to be a useful tool for identifying the potential biological behaviour of adrenocortical lesions. MiRNA-139 was up-regulated in several ACAs (Weiss score=0) of the validation cohort and lacked up-regulation in cases with malignant potential (Weiss score ≥3). Using a cut-off value derived from the test cohort, analysis of miR-335 expression levels identified correctly three of five cases with highly probable malignant course. Moreover miR-335 and 675 levels were markedly increased in two cases, with a Weiss score of 1 and 2, respectively. It is tempting to speculate that these cases may exhibit a malignant course. Unfortunately no long term follow-up data exist for these two patients. Especially in the grey zone of tumours with indeterminate malignant potential (Weiss score 1–2), miRNA levels show wide variations, indicating different genetic background alterations in these tumours.
Furthermore, this study confirms that miRNAs extracted from formalin-fixed and paraffin-embedded material can be successfully and reliably applied in routine diagnostic pathology.
There seems to be a large number of significantly expressed miRNAs in adrenal tumour pathology, depending on the nature of the lesion as well as the underlying endocrine pathobiology resulting in either Conn or Cushing syndrome. The DIANA-micro T algorithm was used to predict possible target genes of the identified key miRNAs (table 5).
Potential targets for miRNA-675, miR-139-3p and miR-335
Interestingly, miRNA-675 and miRNA-139-3p share a common target gene (GLI4). However, this basic study was not designed to analyse possible functional effects of single miRNAs. Further experiments are in progress to elucidate the association of miRNA regulation/deregulation with already identified or putative target genes. We are aware that at this point of time little is known about the potential functional relevance of the identified miRNA in adrenocortical tumours.
In conclusion, this study provides a rich source of information about miRNAs that are differentially expressed in normal, benign and malignant adrenocortical tumours. In contrast to the study of Soon et al,16 we found a much larger number of miRNAs to be significantly differentiated between ACA and ACC. However, due to overlapping miRNA expression values in the validation cohort, a single miRNA value is not capable of clearly separating benign from malignant adrenocortical lesions. Nevertheless, using proposed cut-off values, expression analysis of miR-675 and miR-335 seems to offer highly valuable information about the potential subsequent malignant behaviour of lesions with indeterminate malignancy.
Take-home messages
MicroRNAs (miRNAs) possess a tremendous potential as diagnostic biomarkers in surgical pathology.
Up to 159 miRNAs were up-regulated and up to 89 were down-regulated in adrenocortical carcinomas (ACCs) compared to adrenocortical adenomas (ACAs).
miR-335 and miR-675 expression levels helped to distinguish ACAs from ACCs and may help in identifying adrenocortical tumours with malignant behaviour.
References
Footnotes
Funding This work has been supported by the local research fund (IFORES) of the University of Essen.
Competing interests None.
Provenance and peer review Not commissioned; externally peer reviewed.