Article Text

Abstract
Aims Establishing probe-based analysis is important for developing multi-photon microscopy (MPM) to make an early diagnosis of colon neoplasm and assess its antioxidant status. Cu(I) and Zn(II) ions are trace elements which roll as cofactors of antioxidant, superoxide dismutase. However, there have been no reports on the features of MPM image using probe of Cu(I) and Zn(II) ions. Our main objective in this study was application of newly developed multi-photon probe (MP) probe on Cu(I) and Zn(II) ions as a tool to assess antioxidative status of colon neoplasm.
Methods This study was a pilot study. Colon cancer cell lines (ACT116 and HT-29), NIH3T3 cells and tissues of normal colon mucosa and colon neoplasm obtained during colonoscopic biopsy from 17 patients were stained with MP probes for Cu(I) and Zn(II) (ACu1 and AZn1). Cu(I)/Zn(II) levels in the cells and tissues were determined by detecting MP-excited fluorescence by MPM.
Results MPM images of cells stained with MP probes revealed that Cu(I) was more abundant in ACT116 and HT-29 cells than in NIH3T3 cells, while Zn(II) was more abundant in NIH3T3 cells than in ACT116 and HT-29 cells. Normal tissues had a defined texture, whereas adenoma/adenocarcinoma tissues were amorphous. The level of Cu(I) increased and that of Zn(II) decreased with the transition from normal to adenoma to adenocarcinoma tissue.
Conclusion MPM can be used to determine the relative Cu(I)/Zn(II) levels in cells and colon tissues by using ACu1 and AZn1 as MPM probes. These finding are new research tools for gastroenterologists to assess antioxidant status of colon neoplasm.
- Carcinoma
- cancer
- GI neoplasms
This is an open-access article distributed under the terms of the Creative Commons Attribution Non-commercial License, which permits use, distribution, and reproduction in any medium, provided the original work is properly cited, the use is non commercial and is otherwise in compliance with the license. See: http://creativecommons.org/licenses/by-nc/3.0/ and http://creativecommons.org/licenses/by-nc/3.0/legalcode
Statistics from Altmetric.com
Introduction
Colon cancer is one of the most common malignancies and is a leading cause of death in developed countries.1 It is well recognised that carcinogenesis is a multistep process in which sequential genetic alterations aided by environmental factors, such as oxidative stress and antioxidant levels, favour the selection and proliferation of malignant clones, eventually leading to the development of a detectable tumour.2 Because Cu(I) and Zn(II) are cofactors of superoxide dismutases, which are antioxidant enzymes, alterations of the concentrations of these metal ions may be related to neoplasm and malignancy.3 Indeed, several studies have shown that serum Cu(I) levels are elevated in various malignancies, such as breast cancer.4 Furthermore, significant alterations (either an increase or decrease compared with normal levels) in Zn(II) levels in tissues have been reported in patients with various forms of cancer. Moreover, low plasma Zn(II) levels have been observed in patients with cancer of the colon, bronchus or digestive system.3–7 The mechanism by which serum and tissue Zn(II) levels decrease in various cancerous tissues, and how this contributes to carcinogenesis is still obscure.3–7 Nevertheless, some studies have suggested that the Cu(I)/Zn(II) ratio would be an indicator of the extent and prognosis of carcinomas.5 ,8–10 However, most of these studies used complex techniques, such as atomic absorption spectrophotometric analysis of tissue samples prepared by dry ashing at 500°C.5 ,6 ,11
An attractive approach to determine the three-dimensional (3D) distribution of Cu(I)/Zn(II) levels and the Cu(I)/Zn(II) ratio in colon tissue is the use of multi-photon microscopy (MPM). MPM, which employs more than two near-infrared photons as the excitation source, has attracted much interest in biology and medicine due to the distinct advantages this technique offers.12 These advantages include greater penetration depth (∼500 μm), reduced photodamage, ability to image turbid samples and negligible background cellular autofluorescence compared with its single-photon counterpart, thereby allowing intact tissue imaging with high resolution (<300 nm) for a long period of time (∼1 h). Moreover, one can obtain hundreds of sectional images along the z direction in 300 nm steps without slicing the tissue13–15 from which 3D distributions of the metal ions can be assessed. However, no prior study has reported the 3D distributions of Cu(I)/Zn(II) levels or the Cu(I)/Zn(II) ratios in colon tissues. In this study, we determined the 3D distributions of Cu(I)/Zn(II) levels and Cu(I)/Zn(II) ratios in normal and malignant colon tissues by MPM using ACu1 and AZn1 as the MP probes, and studied their relevance to malignancy.
Methods
MP probes for Cu(I) and Zn(II)
MP probes for Cu(I) and Zn(II) (ACu1 and AZn1) that we developed and patented were used in this experiment (figure 1).16 ,17 The dissociation constants measured by multi-photon process (KdTP) of ACu1 and AZn1 are 3.6 pM and 1.1 nM, respectively.16 ,17

Structure of ACu1 and AZn1.
MPM imaging of cell lines using MP probes for Cu(I) and Zn(II)
The colon cancer cell lines, HCT 116 and HT-29, and NIH3T3 (mouse embryonic fibroblast cell line) were obtained from the Korean Cell Line Bank. The cells were kept in a humidified atmosphere of 5:95 (v:v) CO2:air at 37°C. Two days before imaging, the cells were passaged and plated on glass-bottomed dishes (MatTek Corporation, Ashland, Massachusetts, USA). For labelling, the growth medium was removed and replaced with RPMI1640 without foetal bovine serum. The cells were incubated with 2 μM of ACu1 or AZn1 and Pluronic F-127 for 30 min at 37°C and were then washed three times with RPMI1640 without foetal bovine serum. The Cu(I)/Zn(II) levels were determined by detecting the MP-excited fluorescence (MPEF) intensities of the cells. The average MPEF intensities per pixel are reported in numbers between 0 and 250 as calculated by the Leica confocal software, Histogram.
MPM imaging of colon tissues using MP probes for Cu(I) and Zn(II)
Acquisition of human samples
Outpatients who underwent an elective colonoscopy at Korea University Anam Hospital were recruited to participate in this study, which was approved by the hospital ethics committee, and all participating patients provided informed consent. Patients older than 18 years of age who had the ability to provide informed consent were included. Patients who had known or suspected bleeding disorders, an international normalised ratio of prothrombin time exceeding 1.4, a platelet count of >100 000, or who had used aspirin within the previous 5 days, were excluded. During the colonoscopy examination, tissues from malignant lesions, adenomas and normal mucosa were obtained by biopsy forceps through the scope. Normal colon mucosal and adenoma or adenocarcinoma tissues were collected from the same patients. Standard biopsy forceps (Olympus Medical Systems Corporation, Tokyo, Japan) were used to obtain paired mucosal pinch biopsy specimens from the colon. Each pair of biopsy specimens was separated so that one could be imaged to determine the Cu(I) distribution, and the other the Zn(II) distribution. The tissues were placed in sterile specimen bottles containing PBS (phosphate buffer solution). Then, the tissues were stained with 20 μM of ACu1 or AZn1 in artificial cerebrospinal fluid for 1–2 h at 37.8°C.
Multi-photon fluorescence microscopy
MPM images were obtained with a DM IRE2 Microscope (Leica Microsystems GmbH, Wetzlar, Germany) with a ×100 (NA =1.30 OIL, figures 2, 3 and 5) and ×10 (NA =0.30 DRY, Figures 4 and 5) objective lens, respectively, by exciting the probes with a mode-locked titanium-sapphire laser source (Coherent Chameleon, 90 MHz, 200 fs) set at a wavelength of 760 nm, and an output power of 1230 mW, which corresponds to approximately 10 mW average power in the focal plane. To obtain MPM images at the 500–620 nm range, internal photo-multiplier tubes were used to collect the signals in 8-bit unsigned 512 × 512 pixels at a scan speed of 400 Hz.

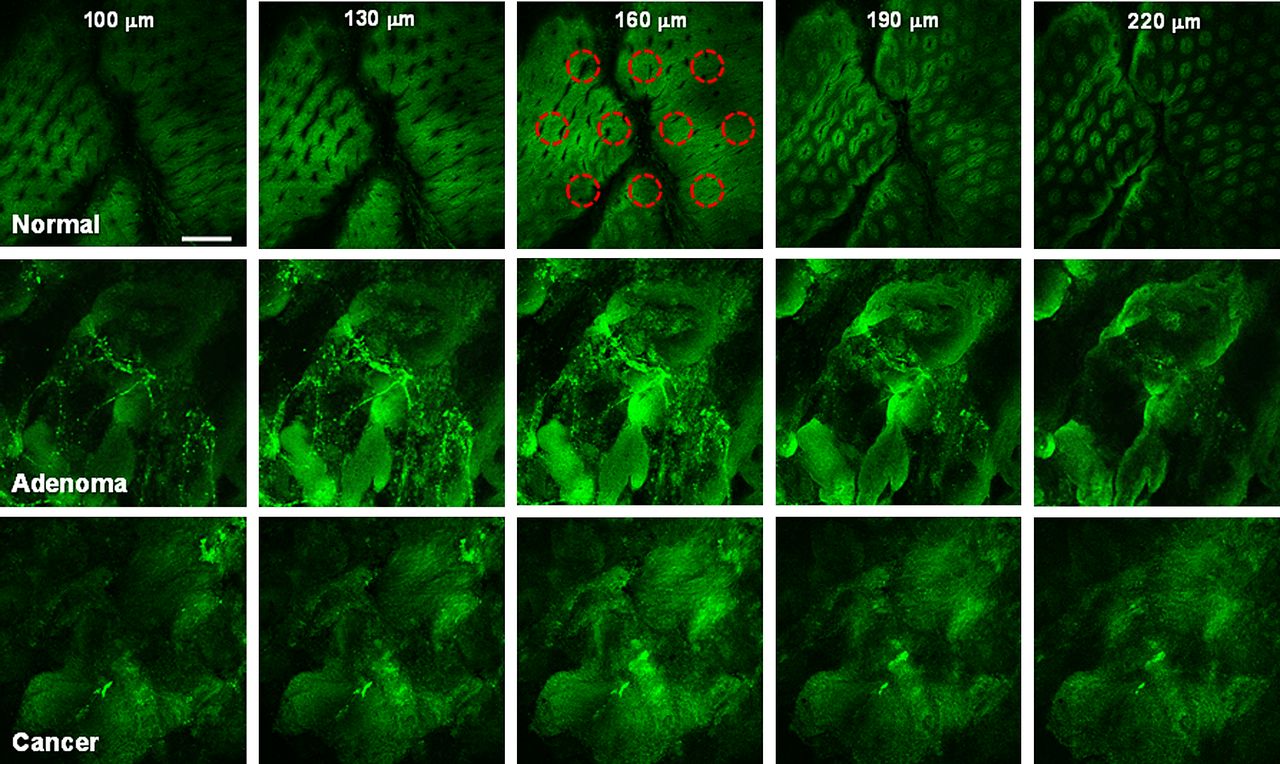
Multi-photon microscopy images of normal, adenoma and cancer tissues labelled with 20 μM ACu1 obtained along the z-direction in the range of 100–220 μm. The multi-photon excited fluorescence (MPEF) was collected at 500–620 nm upon excitation at 750 nm with a 200 fs pulse. Scale bar, 300 μm. Tissues shown are representative images from replicate experiments (n=75). The regions of interest where the MPEF intensities were collected for Figure 5 are indicated by red circles.

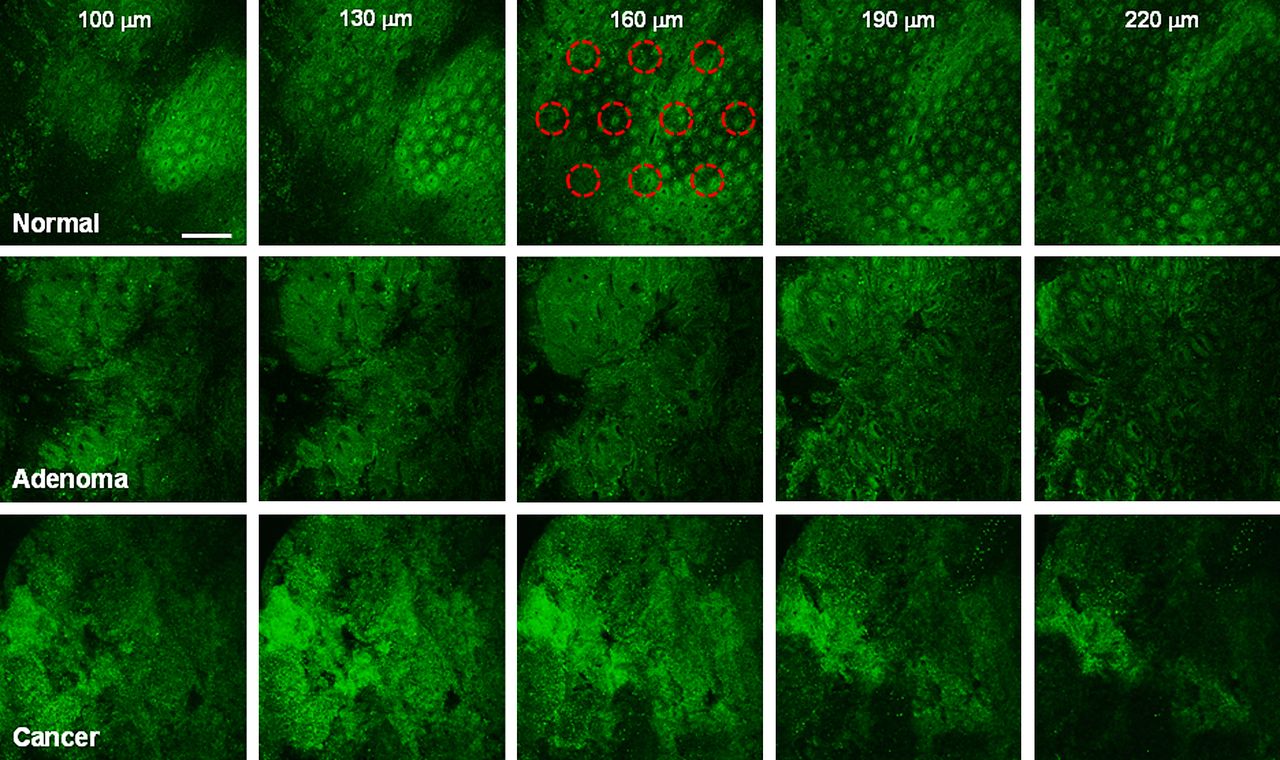
Multi-photon microscopy images of normal, adenoma, and cancer tissues labelled with 20 μM AZn1 obtained along the z-direction in the range of 100–220 μm. The regions of interest (ROIs) where multi-photon excited fluorescence intensities (MPEF) were collected are indicated by red circles. The MPEF was collected at 500–620 nm upon excitation at 750 nm with a 200 fs pulse. Scale bar, 300 μm. Tissues shown are representative images from replicate experiments (n=75). The ROIs where the MPEF intensities were collected for Figure 5 are indicated by red circles.

Bright field (A–F) and multi-photon microscopy (G–I) images of normal (NIH 3T3) and colon cancer cells (HCT 116, HT-29) labelled with 2 μM ACu1 (G–I) and AZn1 (J–L). The MPEF was collected at 500–620 nm upon excitation at 750 nm with a 200 fs pulse. Scale bar, 300 μm. Cells shown are representative images from replicate experiments (n=5).

Colonoscopic images (lower left), bright field, and multi-photon microscopy images of normal, adenoma and cancer tissues labelled with 20 μM ACu1 (lower middle) and 20 μM AZn1 (lower right) obtained at a depth of 120 μm. Relative multi-photon excited fluorescence intensities per region of interest from tissues labelled with 20 μM ACu1 (upper left) and 20 μM AZn1 (upper right) (see Methods for details). The MPEF was collected at 500–620 nm upon excitation at 750 nm with a fs pulse. Scale bars, 300 (×10) and 30 (×100) μm. Tissues shown are representative images from replicate experiments (n=75).
Marker for antioxidant of colon cancer
Three-dimensional distribution of Cu(I)/Zn(II) and relative Cu(I)/Zn(II) levels in colon tissues.
To determine 3D distributions of Cu(I)/Zn(II) in colon tissues, the MPEF was detected from 7–8 xy planes along the z axis at a depth of 100–220 μm. In each plane, 10 regions of interest (ROI) were randomly chosen (figures 2 and 3). The MPEF intensities from the 70–80 ROIs from the 7–8 xy planes were added, and the sum was divided by the total number of ROIs to obtain the average MPEF intensity per ROI. This value was used as the relative Cu(I)/Zn(II) level in each tissue.
Statistical analysis
This study was a pilot study. The significance of differences in Cu(I)/Zn(II) levels and ratios in normal and neoplastic tissues were assessed using the Wilcoxon signed rank test. Results are expressed as mean ± SD. The significance level was set at p<0.05.
Results
MPM images of cell lines
The distribution of Cu(I) and Zn(II) in the cytoplasm was evaluated using the MPM images of cells (figure 4). Brighter images were obtained for ACT116 and HT-29 cells than NIH3T3 cells when cells were labelled with ACu1, while the opposite trend was observed for cells labelled with AZn1. This indicates that Cu(I) is more abundant in colon cancer cells (ACT116 and HT-29) than in normal cells (NIH3T3), while Zn(II) is more abundant in normal cells than in cancer cells (figure 4).
MPM imaging of human colon tissues
Human colon tissues were obtained from patients with a histologically confirmed diagnosis of colon adenoma. A total of 17 patients were enrolled in this study; there were no significant differences in the average age, gender or baseline characteristics of patients, as shown in table 1.
Clinical features of adenoma patients and adenocarcinoma patients
The MPM images of colon tissues labelled with ACu1 and AZn1 clearly revealed that Cu(I) and Zn(II) ions were distributed at depths of 100–220 μm (figures 2 and 3). The textures of the normal tissues were defined, while adenoma/adenocarcinoma tissues were amorphous for their entire depth (figures 2 and 3). In a given tissue, the 3D distributions of Cu(I)/Zn(II) levels were almost the same. However, the Cu(I) level increased, and the Zn(II) level decreased with the transition from normal to adenoma to adenocarcinoma tissue (figure 5). The Cu(I)/Zn(II) ratio was 3.5-fold higher in adenoma/adenocarcinoma tissue than normal tissue (table 2).
Relative Cu(I) and Zn(II) levels and the Cu(I)/Zn(II) ratio estimated from the average MPEF from normal mucosa tissue and colon tumour tissues labelled with ACu1 and AZn1 median(min, max)
Discussion
MPM, a fluorescence microscopy technique for imaging of thick tissues and live animals, has become an invaluable tool for cancer researchers investigating angiogenesis and metastasis in vivo, immunologists investigating lymphocyte trafficking, and embryologists visualising a day in the life of a developing hamster embryo.12
We performed this study to determine the Cu(I)/Zn(II) ratios in cells and colon tissues by MPM, and to investigate the relationship between the Cu(I)/Zn(II) ratio and malignancy. We employed ACu1 and AZn1 as the MP probes; these probes have dissociation constants (KdTP) of 3.6 pM and 1.1 nM, respectively, and are therefore used in MPM to detect Cu(I) and Zn(II) ions in picomolar and nanomolar ranges, respectively.16 ,17 However, we did not attempt to quantitatively measure Cu(I)/Zn(II) levels because these probes are turn-on probes, and the MPEF intensities can be affected by many factors, such as the degree of loading and the polarity of the tissue.
ACT116 and HT-29 cells labelled with ACu1 yielded brighter MPM images than NIH3T3 cells, while the opposite result was observed for cells labelled with AZn1. These results indicate that Cu(I) is more abundant in cancer cells than in normal cells, while Zn(II) is more abundant in normal cells than in cancer cells. In colon tissues, as the tissues changed from normal to adenoma to adenocarcinoma, the Cu(I) level increased gradually and the Zn(II) level decreased, resulting in a gradual increase in the Cu(I)/Zn(II) ratio. This outcome is consistent with the literature results based on atomic absorption spectrophotometric studies of tissues dried at 500°C.5 ,6 ,11
Moreover, the Cu(I)/Zn(II) ratio increased 3.5-fold from normal to adenoma/adenocarcinoma tissue (table 2). This result suggests that a high Cu(I)/Zn(II) ratio is indicative of colon adenocarcinoma.
There are several distinct advantages to using MPM with efficient MP probes in cancer research. First, MPM images of tissues labelled with AZn1 and ACu1 clearly revealed the metal ion distributions at different depths in the range of 100–220 μm (figures 2 and 3). MPM images of normal tissue showed a defined texture for the entire depth of tissue, while adenoma/adenocarcinoma tissues had an amorphous texture. In-depth imaging is not possible with conventional light microscopy or confocal microscopy. Second, it was easy to assess the difference in metal ion levels in normal and malignant tissues by comparing the MPEFs of these tissue samples. Although the reason for this difference is not known, it can provide a clue as to whether the tissue is healthy or not. Moreover, by comparing the depth images of the tissues, it is possible to detect the extent to which the malignancy has progressed. Also, MPM images can be obtained within a few hours after biopsy. Tissues that are examined under a light microscope for conventional pathologic diagnosis have to go through procedures, such as fixation in formalin, paraffin embedding, slicing, H&E staining and/or immunohistochemistry staining, which is time consuming, requiring at least 2–3 days for results. In contrast, fresh living tissue from biopsy specimens can be observed directly with MPM, thus obviating the time-consuming procedures required for conventional microscopy.
There are two limitations to our study. First, Cu/Zn levels were not quantitatively validated by atomic absorption spectrophotometry. Second, our probes were turn-on probes, not ratiometric probes, and therefore, the MPEF intensities that we observed could have been affected by different staining intensities and different polarities in different regions of the tissues. For quantitative analysis, ratiometric MP probes for Cu(I) and Zn(II) are needed. However, MPEF intensity is linearly proportional to the metal ion content in tissues.16 ,17 Therefore, the Cu(I)/Zn(II) ratios measured by MPM should reflect the real ratios and could be used as a novel tool for assessing colon neoplasms.
In conclusion, we reported the results of a feasibility study of MPM for the diagnosis of colon cancer using ACu1 and AZn1 as the MP probes. MPM images revealed that normal tissues had an intact architecture, while adenoma/adenocarcinoma tissues were amorphous for their entire depths. Moreover, the Cu(I)/Zn(II) ratio was 3.5-fold higher in adenoma/adenocarcinoma tissues than normal tissues. The Cu(I)/Zn(II) ratio can therefore be used as a new tool to diagnose malignancy. There are several distinct advantages to using MPM. First, MPM images of the tissues can clearly reveal the metal ion distribution at different depths in the range of 100–220 μm. Second, the difference in the metal ion levels in normal and malignant tissues are easy to assess by comparing the MPEFs of the different tissue samples. Third, the MPM images can be obtained within a few hours after biopsy. We are currently developing ratiometric MP probes for Cu(I) and Zn(II) to obtain more quantitative measurements.
Take-home messages
MPM can be used for functional and dynamic cellular imaging when combined with multiphoton fluorescence probes.
There was a significant increase in mean Cu level and Cu/Zn ratio in human colon neoplasm compared with normal colon mucosa.
Tissue zinc level in human colon neoplasm, including adenoma and adenocarcinoma, was significantly lower than in the normal colon mucosa.
References
Footnotes
ESK and CSL contributed equally to this work. This study was approved by Institutional Review Board of Korea University Anam Hospital.
Funding Funding for this work was provided the Korea Healthcare Technology R&D Project, Ministry of Health & Welfare, Republic of Korea (A111182).
Competing interests None.
Provenance and peer review Not commissioned; externally peer reviewed.