Article Text

Abstract
Background Automated scanning devices and image analysis software provide a means to overcome the limitations of manual semiquantitative scoring of immunohistochemistry. Common drawbacks to automated imaging systems include an inability to classify tissue type and an inability to segregate cytoplasmic and nuclear staining.
Methods Immunohistochemistry for the membranous marker α-catenin, the cytoplasmic marker stathmin and the nuclear marker Ki-67 was performed on tissue microarrays (TMA) of archival formalin-fixed paraffin-embedded tissue comprising 471 (α-catenin and stathmin) and 511 (Ki-67) cases of prostate adenocarcinoma. These TMA were quantitatively analysed using two commercially available automated image analysers, the Ariol SL-50 system and the Nuance system from CRi. Both systems use brightfield microscopy for automated, unbiased and standardised quantification of immunohistochemistry, while the Nuance system has spectral deconvolution capabilities.
Results Overall concordance between scores from both systems was excellent (r=0.90; 0.83–0.95). The software associated with the multispectral imager allowed accurate automated classification of tissue type into epithelial glandular structures and stroma, and a single-step segmentation of staining into cytoplasmic or nuclear compartments allowing independent evaluation of these areas. The Nuance system, however, was not able to distinguish reliably between tumour and non-tumour tissue. In addition, variance in the labour and time required for analysis between the two systems was also noted.
Conclusion Despite limitations, this study suggests some beneficial role for the use of a multispectral imaging system in automated analysis of immunohistochemistry.
- Cancer genetics
- cancer research
- cancer stem cells
- circulating tumour cells
- gynaecological pathology
- haematopathology
- histopathology
- image analysis
- immunohistochemistry
- metabolism
- molecular oncology
- molecular pathology
- ovarian tumour
- prostate
- urogenital pathology
- uropathology
Statistics from Altmetric.com
- Cancer genetics
- cancer research
- cancer stem cells
- circulating tumour cells
- gynaecological pathology
- haematopathology
- histopathology
- image analysis
- immunohistochemistry
- metabolism
- molecular oncology
- molecular pathology
- ovarian tumour
- prostate
- urogenital pathology
- uropathology
Over the years, identifying tissue biomarkers has been the focus of a large body of research to help classify cancers for diagnostic, prognostic and therapeutic purposes. This ability to subclassify cancers is dependent on the means of quantifying the amount of biomarker present in tissue. Immunohistochemistry is a technique frequently used to visualise protein present in tissue. Traditionally, histopathologists have scored immunohistochemistry manually; however, this can be labour and time intensive, semiquantitative and subject to observer bias. Comparisons of scoring methods by different pathologists have shown relatively accurate reproducibility of scores for the intensity of staining but a pronounced lack of reliability for the extent of staining.1 Tissue microarrays (TMA) allow immunohistochemical analysis of large numbers of tumour samples in a high-throughput manner. Potentially up to 400 tissue cores representing more than 130 tumours in triplicate can be placed onto one TMA block. While this allows for increased speed of analysis, it is still inefficient when scored semiquantitatively by pathologists. In addition, it can also be difficult to set an appropriate quantitative scale that can be accurately followed by the observer.2 As such, automated scanning devices and image analysis software coupled with TMA may provide a means to overcome such limitations.3
Various methods of automated scoring of immunohistochemistry have proved to be an effective substitute for manual scoring. The Ariol SL-50 system (Genetix, San Jose, California, USA) is a widely used platform for automated immunohistochemical analysis.2 4 5 Quantitative scores using this system show very good correlation with semiquantitative manual scores in both small and large study cohorts, with comparable patient outcome data generated from both systems of analysis.4–6 Furthermore, these and other studies have indicated that automated quantitative systems are an excellent substitute for manual semiquantitative scoring by a pathologist.5 7–9 Of importance, automation reduces the labour and time required to score immunohistochemically, and can also produce improvements in scoring such as the reproducibility and reliability of the score for the total area of staining.1 4 Indeed, automated systems may help lead to a standardised system of immunohistochemical scoring and reduce the dependence of scores on arbitrary thresholds.10
However, computational image analysis is not without problems. Tumour tissue may be quite heterogenous morphologically, comprising both epithelial and stromal compartments; this can be difficult to analyse consistently using existing computer software programs. Some tumours, such as prostatic adenocarcinoma, can cause special problems with analysis due to the infiltrative nature of malignant glands among normal epithelial tissue and prostatic intra-epithelial neoplasia coexisting adjacent to invasive adenocarcinoma. The major limitation of some automated systems is an inability to classify the tissue type automatically. This necessitates manually marking tumour areas for analysis for each core on a TMA. The software programs are also imperfect at segmenting tissue into nuclear and cytoplasmic areas, especially when there is strong intense immunohistochemical staining. Furthermore, there may be problems with colour pattern recognition. The AQUA system, a fluorescence-based system with subcellular compartmentalisation capabilities, has previously been used to quantify biomarkers such as α-methylacyl coenzyme A racemase and epidermal growth factor receptor specifically in tumours, but it typically requires the process of masking using other biomarkers, and may not work in all situations.2 11 In addition and importantly, cytokeratins mask both normal and neoplastic epithelial tissues, without the capability of differentiating between these compartments. Software that could automate the process of tumour classification and improve tissue segmentation for quantitative scoring would mean significant progress for the analysis of immunohistochemistry. The commercially available Nuance system from CRi (Woburn, Massachusetts, USA) could potentially help fill this gap, as its multispectral capabilities have the ability to separate visual components to demarcate different cellular components.12 In this study we show that automated quantitative analysis of immunohistochemistry on TMA using the Nuance system produces comparable results to the Ariol system. Furthermore, we demonstrate both the added advantages of a multispectral imager for such image analysis and also the potential shortcomings of such a system.
Methods
Case selection
As proof of principle we focused on cases of prostatic adenocarcinoma as these cancers tend to exhibit heterogeneity in terms of morphology. These samples were obtained from the Swedish Watchful Waiting Cohort, which consists of samples from a population-based cohort of men with localised prostate cancer diagnosed incidentally by transurethral resection of the prostate for symptomatic benign prostatic hyperplasia, as previously described.13 14 While these samples were collected and immunohistochemically stained primarily for parallel studies, we have used them to compare the image analysis systems as a proof of principle. A total of 571 and 411 cases was represented on five and six TMA for two cohorts, respectively (tables 1 and 2).
Study cohort characteristics (Swedish Watchful Waiting Cohort I: stained for stathmin and Ki67)
Study cohort characteristics (Swedish Watchful Waiting Cohort II: stained for α-catenin)
Immunohistochemistry
Four-micrometre sections of each TMA were cut and mounted on glass slides. For antigen unmasking, heat-mediated antigen retrieval was performed on deparaffinised sections by microwaving in citrate buffer (10 mmol/l sodium citrate buffer; pH 6.0) before incubation with primary antibodies. Membranous marker α-catenin (mouse monoclonal; 25B1; Abcam, Cambridge, MA), cytoplasmic marker stathmin (rabbit polyclonal; Cell Signalling, Danvers, MA) and nuclear marker Ki-67 (rabbit polyclonal; Vectorlab, Burlingame, CA) protein levels were examined using dilutions of 1:200, 1:50 and 1:2000, respectively (figure 1). α-Catenin binds to β-catenin, links the E-cadherin complex to the actin cytoskeleton, and stabilises E-cadherin at the adherens junction.15 16 In addition to its role in cell–cell adhesion, α-catenin is also implicated in the regulation of cell proliferation.17–20 The microtubule-associated protein stathmin has been implicated as a putative marker of PI3K pathway activation.21–23 Haematoxylin was used as a counterstain and diaminobenzadine was used for the immunohistochemical stain. Antibody staining was performed using a streptavidin–horseradish peroxidase system (catalogue nos HK340-9K and HK330-9K; Biogenex, San Ramon, California, USA).

Immunohistochemical staining (×20) of prostate adenocarcinoma for membranous marker α-catenin (A), nuclear marker Ki-67 (B) and cytoplasmic marker stathmin (C).
Quantitative image analysis
CRi Nuance system
TMA slides were scanned using the CRi Nuance V.2.8 (Woburn) slide scanner following the standard brightfield TMA protocol. The system acquires images at 20 nm wavelength intervals and combines them into a stack file, which represents one image. This was done automatically to create one image for each core on the TMA. inForm V.0.4.2 software (CRi) was used to analyse the spectral images of each core. Initially, a training set comprising two classes of tissue (that the system would ideally recognise) was created: tumour and other. Representative areas for each of these two classes were marked on 12–16 images from each TMA. The software was trained on these areas using the spectra of both the counterstain (haematoxylin) and the immunostain (diaminobenzadine) and tested to determine how accurately it could differentiate between the two classes (figure 2). The classes ended up being more accurately described as epithelial glandular structures and stroma as manual editing was required to correct tissue classification. This process was repeated until further iterations no longer improved accuracy based on visual inspection of the regions marked by the software.

Tissue segmentation: comparison of a raw image (left) with one with tissue classification using inForm (right) for immunohistochemically stained tissue for α-catenin (A) and stathmin (B).
Histological images were then analysed using the nuclear or cytoplasmic algorithm depending on the antibody. The multispectral imaging capabilities of the Nuance slide scanner allow the software to isolate or segment the nuclei using the unmixed spectra of the nuclear counterstain and the diaminobenzadine immunohistochemical stain used in addition for a nuclear biomarker (figure 3). In turn, cytoplasm was found based on the non-nuclear tumour area. The final score was based on the percentage of the cytoplasmic or nuclear tumour area that was positively stained. A random sample of 30 cores per antibody (corresponding to 5.3% and 7.3% of the tissue cores in each cohort, respectively) were reviewed by study participants (CF, RF, MF) to ensure that assigned scores were appropriate. Cores that were difficult to classify (due to technical artifacts such as folds in the tissue, air bubbles, cores overlapping or due to difficulty in morphological classification) were either eliminated from the analysis or manually edited in order to categorise the tissue appropriately.

Cell segmentation: inForm classified the nuclei of tissue stained with nuclear marker Ki67—raw image (A) with the classified image (B). The nuclear classification is outlined.
Ariol SL-50 system
Corresponding TMA were then scanned and quantitatively scored using the Ariol SL-50 system (Genetix). Scores were generated using the MultiStain assay, providing areas of staining per cell (Area_score), intensity of staining (Intensity_score), and a combination of the two to produce a logarithmic score with an approximately normal distribution (Combination_score). Cytoplasmic and membranous staining was assumed to be proportional to the amount of staining in the whole cell, as these stains showed little non-specific intracellular staining. A Nuclear_score was also calculated based on the percentage of haematoxylin-stained nuclei recognised by the Ariol that were positive for diaminobenzadine staining. Areas of tumour were manually identified with masking of the stroma and normal/benign glands from image analysis.
Time/labour analysis
Study participant (CF) estimated labour and computer time to scan and analyse the entire Swedish Watchful Waiting II Cohort corresponding to 1200 TMA cores for each stain.
Semiquantitative analysis
Although human assessment of immunohistochemistry has its limitations it remains the gold standard, so as proof of principle α-catenin was scored semiquantitatively, to allow for three-way comparison of manually generated scores with those generated by the automated image analysis systems. One pathologist (NC, blinded to the original diagnosis) scored the sections independently. A modified visual semiquantification method was used using a one-score system for immunointensity as staining for α-catenin was homogenous. The semiquantification for immunointensity was scored on a scale of: 0, negative; 1, weak; 2, strong. Scores from all cores from one case were averaged.
Statistical analysis
Correlation between inForm and Ariol scores and manual semiquantitative scores were calculated using Spearman's correlation coefficient with R V.2.7.0 (R Foundation for Statistical Computing, Vienna, Austria).
Results
Masking
The inForm software identified the tumour regions of the tissue with a high degree of accuracy (figure 3). There was, however, a number of cores that required manual editing of the tissue classification mask due to poor tissue quality, benign glands mixing with malignant glands (figure 3), or simple mislabelling by the algorithm. These accounted for 10.7% of α-catenin cores (data not shown). Manual editing of the cores was able to correct tissue classification for all downstream analysis. Nuclear and cytoplasmic classification by the inForm software was also found to be accurate for the vast majority of cores analysed (figure 3).
Quantitative image analysis
The raw image analysis data are presented in figure 4. The correlation between inForm and Ariol scores was dependent on the immunohistochemical stain and was high overall (table 3). The overall correlation between the ranks of the cores using the inForm scores and the Ariol scores for all stains was 0.877 (Spearman's rank correlation; p<0.001).

Concordance between immunohistochemical scores generated for each tissue sample by quantitative image analysis using the CRi system and the Ariol system, shown as dotplots for α-catenin (A), stathmin (B) and Ki67 (C). For Ki67, both distributions show a strong clustering at the low end of the spectrum, and a low number of cases with high scores. Based on this, the samples with a score in the 80% percentile were calculated, and found to overlap with a rate of 0.6824 (those cases positive in one that are also positive in the other: 116/170). The overlap is 0.6486 for the averaged samples (48/74).
Spearman correlation coefficients between inForm binning scores and Ariol scores (mean intensity, area and combination score)
Semiquantitative analysis
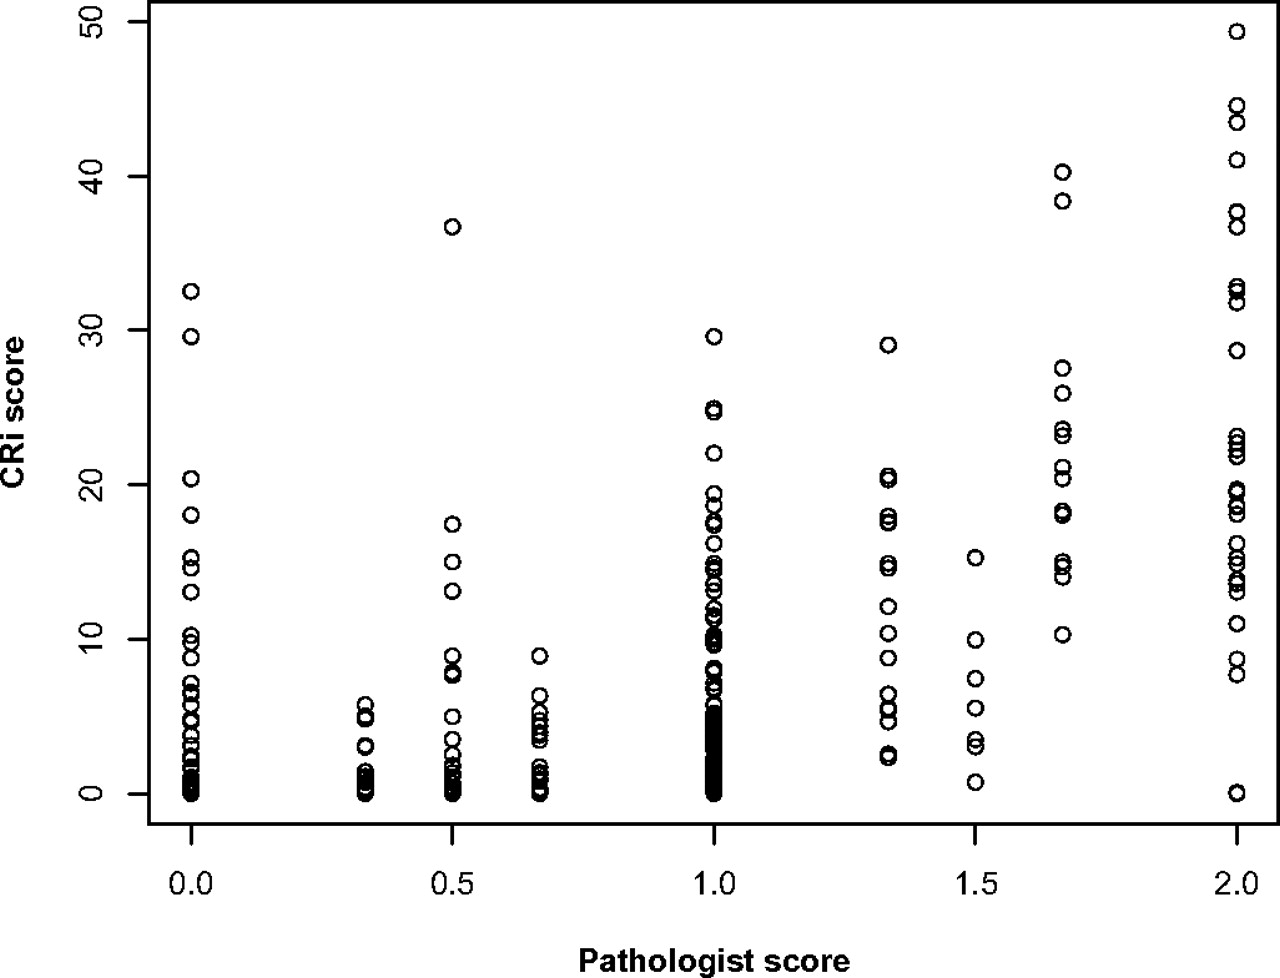
Concordance between manual semiquantitative scores generated for α-catenin and quantitative scores generated by the CRi and Ariol systems was 0.591 (p<0.0001) and 0.589 (p<0.0001), respectively (Spearman's rank correlation; figure 5).
Concordance between immunohistchemical scores generated for Ki67-stained tissue using the CRi system and semiquantitative scores by a pathologist, shown as a dotplot. The concordance between the two scores is good (Spearman's rank correlation 0.591).
Time/labour analysis
Two and a half hours of human time and 15 h of computer time was required to scan and analyse the Swedish Watchful Waiting II Cohort for each stain using the CRi Nuance system; 7.5 h of human time and 7.5 h of computer time was required to scan and analyse each stain of the same cohort using the Ariol SL-50 system.
Discussion
The Ariol SL-50 system is an established tool for quantitatively scoring immunohistochemistry on TMA.24–26 Here we show a strong concordance between scores generated for cytoplasmic and nuclear immunohistochemistry from both the CRi Nuance V.2.8 scanner and the Ariol SL-50 system, illustrating the utility of the Nuance imager and inForm software for quantitatively scoring immunohistochemistry. Ki67 is the only stain that did not have a correlation value above 0.9. It remains to be seen whether this represents a strong improvement or a drawback of the CRi system, as a very high concordance with the Ariol does not necessarily represent total biological accuracy. The high correlation values seen for α-catenin for all three scores from the Ariol highlights the ability of the binning score to reflect differences in intensity as well as the percentage of staining, simplifying the scoring of different stains. Furthermore, the good correlation between semiquantitative manual scoring and the Ariol/CRi scores suggests that both systems perform equally well at recapitulating human assessment.
The Nuance system has been used previously for multispectral imaging of immunohistochemistry on archival formalin-fixed, paraffin-embedded TMA specimens in order to help distinguish cell types and to quantify tissue biomarkers.27–29 The inForm software allows for the subclassification of tissues and stratification of cells into nuclear and cytoplasmic compartments in a single step. Other groups have used similar automated methods involving intensity thresholds to quantify staining with software from CRi.29 Indeed, inForm offers improvements in a number of areas over RGB (red, green, blue) systems such as the Ariol (box 1), probably reflecting the multispectral imaging capabilities of the Nuance scanner. For brightfield applications, the system collects images along the visible light spectrum at a specified number of intervals (usually every 5–20 nm of wavelength). It then compiles them into an image file, referred to as a cube, in which every pixel has a spectra associated with it. Spectra representing different chromogens are established and can be ‘unmixed’ so as to visualise their contributions to the image. This allows for specific colour recognition without the difficulty in deciphering between similar and overlapping chromogens.3 A similar approach is utilised for fluorescence-based approaches such as quantum dots.30 While we were unable to quantify any improvements in classification, the unmixing of chromogens appears to remove background noise, contributing to a more accurate score. Furthermore, the ability to segment nuclear areas with unmixed chromogen spectra (even when diaminobenzadine masks some of the nuclear counterstain) ensures that nuclear staining is not interrogated as cytoplasmic staining. There are, however, a number of disadvantages to the current CRi system. The major limiting factor is the length of time required to scan individual slides: it takes approximately 30 s per core to scan (an average TMA contained 300–400 cores) following a set-up time of approximately 15–30 min per TMA. In addition, a batch process to analyse the entirety of the image set can take approximately 1 min for every five cores. In contrast, the Ariol system takes approximately 15 s to scan a core following a similar set-up time. Batch processing on the Ariol takes approximately 1 min per four to five cores. Ultimately, this increased time by the CRi system requires little to no human involvement, and the ability of inForm to classify the tissue automatically can help relieve human labour considerably.
List of advantages and disadvantages of the InForm software (CRi) in comparison with the Ariol SL-50 system
inForm advantages
Specific colour recognition.
Machine learning classification of stroma from epithelial tissue in prostate.
Cell by cell information.
inForm disadvantages
Lengthy scans.
Difficulty with prostatic adenocarcinoma classification.
Difficulty with variability in tissue appearance within a cohort.
In our study, as the number of TMA slides was relatively small, the time factor was not an overwhelming issue; it may, however, become an issue for study sets containing large numbers of slides on whole tissue sections. Another drawback of the current inForm software is the inability to distinguish between tumour and benign epithelial glandular elements (it can, however, distinguish between stromal regions and tumour areas). Therefore, during the classification of cores that contain a heterogeneous mix of tissue, the software may mark both tumour and benign prostate as tumour on automated classification, and thus require manual editing of the file to demarcate tumour regions. In this study, the number of cores that required editing varied based on the heterogeneity of cores in a particular cohort and on the staining characteristics of both benign and malignant tissue. The heterogeneity of tissue samples in different cohorts can cause other problems in the analysis. inForm uses ‘projects’ to help classify different tissues and to organise the analysis of images (it allows up to 16 images per training set per project); this usually equates with one project per immunostain and cohort. In some cohorts there is large variability in the appearance of the tissue, making it difficult for inForm to account for every general tissue appearance. This can lead to a number of cores being misclassified. Splitting up the cohort into smaller projects can help with classification in these scenarios; this will lead to additional set-up time and potentially could lead to scoring bias. Notably for both systems, pathologist input to delineate tumour and normal tissue is essential. While Ariol requires masking on each core to identify tumour, the inForm system can automatically identify glandular tissue that must then be differentiated from tumour manually. We show that whether performed manually for each core as with Ariol or following the recognition of epithelial tissue as with inForm, high concordance rates between scores from the two different systems and with semiquantitative manual scoring can be maintained.
In conclusion, this study suggests a beneficial role for the use of a multispectral imaging system in the automated analysis of immunohistochemistry, and highlights both the inherent advantages and shortcomings of the system when compared with traditional automated and semiquantitative analysis systems.
Take-home messages
The Nuance system from CRi allows for automated analysis of immunohistochemistry using multispectral imaging.
The scores from the Nuance system and Ariol system are highly correlated, but differences in specific instances could point to functional biology and/or drawbacks in the individual systems.
There are many factors to consider when choosing an automated scoring system, such as time, labour, reliability and simplicity.
Acknowledgments
The authors would like to thank Edward Stack for his help in assembling images.
References
Footnotes
Funding ML is supported by the Prostate Cancer Foundation, the National Cancer Institute (RO1CA131945, PO1CA89021 and P50 CA90381), the Linda and Arthur Gelb Center for Translational Research and a gift from Nuclea Biomarkers to the Jimmy Fund and the Loda laboratory. ML is also the recipient of a grant from the Dana Farber Cancer Institute–Novartis Drug Development Program.
Competing interests None.
Provenance and peer review Not commissioned; externally peer reviewed.