Article Text

Abstract
Aims Patients with colorectal cancer harbouring KRAS mutations do not respond to antiepidermal growth factor receptor (anti-EGFR) therapy. Community screening for KRAS mutation selects patients for treatment. When a KRAS mutation is identified by direct sequencing, mutant and wild type alleles are seen on the sequencing electropherograms. KRAS mutant allele-specific imbalance (MASI) occurs when the mutant allele peak is higher than the wild type one. The aims of this study were to verify the rate and tissue distribution of KRAS MASI as well as its clinical relevance.
Methods A total of 437 sequencing electropherograms showing KRAS exon 2 mutation was reviewed and in 30 cases next generation sequencing (NGS) was also carried out. Five primary tumours were extensively laser capture microdissected to investigated KRAS MASI tissue spatial distribution. KRAS MASI influence on the overall survival was evaluated in 58 patients. In vitro response to anti-EGFR therapy in relation to different G13D KRAS MASI status was also evaluated.
Results On the overall, KRAS MASI occurred in 58/436 cases (12.8%), being more frequently associated with G13D mutation (p=0.05) and having a heterogeneous tissue distribution. KRAS MASI detection by Sanger Sequencing and NGS showed 94% (28/30) concordance. The longer overall survival of KRAS MASI negative patients did not reach statistical significance (p=0.08). In cell line model G13D KRAS MASI conferred resistance to cetuximab treatment.
Conclusions KRAS MASI is a significant event in colorectal cancer, specifically associated with G13D mutation, and featuring a heterogeneous spatial distribution, that may have a role to predict the response to EGFR inhibitors. The foreseen implementation of NGS in community KRAS testing may help to define KRAS MASI prognostic and predictive significance.
- COLON
- MOLECULAR BIOLOGY
- TUMOUR MARKERS
Statistics from Altmetric.com
Introduction
Worldwide, a million patients are diagnosed with colorectal cancer (CRC) annually, and 50% of them will one day develop metastatic disease.1 Epidermal growth factor receptor (EGFR) is targeted by cetuximab and panitumumab monoclonal antibodies.2 However, several clinical trials have demonstrated that approximately 40% patients, whose tumour has KRAS mutations, do not benefit from these drugs.3–6 Thus, community testing for KRAS mutation has been introduced and many laboratories adopt direct sequencing. When a KRAS mutation is identified by direct sequencing, mutant and wild type alleles are seen on the sequencing electropherograms.7 In some instances, even if the tumour has not been microdissected, the mutant allele appears to be in great excess of the wild type allele.8 The mutant allele may become dominant when deletion of the wild type allele and/or chromosome 12 hyperploidy or KRAS amplification occurs, leading to mutant allele-specific imbalance (MASI).8 This latter, in turn, leads to elevated KRAS mRNA level and increased GTPase activity.8 To date, little investigation has been dedicated to KRAS MASI.9–11 Only Hartman et al reported that in CRCs MASI occurs in 19.7% of KRAS mutant cases more commonly in codon 13 (30%) than in codon 12 (17%).9 These authors demonstrated that KRAS codon 13 MASI is an independent adverse prognostic factor and suggested that it may also influence the response to anti EGFR treatment.9 Thus, quantifying mutant allele may be considered when reporting the KRAS mutational status.12 However, none of the studies considered whether KRAS MASI occurs evenly in tumour tissue or it has a subclonal distribution. Thus, further investigation is required to confirm and clarify the biological significance and the clinical role of KRAS MASI, also exploiting novel technologies, such as next generation sequencing (NGS) that allow for a quantitative assessment of the mutant allele.13
Our molecular laboratory is the largest volume reference centre for community KRAS testing in South Italy.14 A large number of sequencing electropherograms derived by our routine practice were reviewed to verify the rate and tissue distribution of KRAS MASI as well as its prognostic clinical relevance. In a subset of samples the sequencing electropherograms semiquantitative review was compared with MASI evaluation by NGS. Moreover, since G13D MASI may have a role as an anti-EGFR therapy predictive marker,9 the effect of the G13D copy number on the cetuximab treatment in cell line models was also evaluated.
Methods
KRAS MASI determination
Since KRAS mutational analysis is part of the routine diagnostic workup of patients with metastatic CRC the need for an ethics committee approval was not necessary for this study, in accordance with medical ethical guidelines of the Azienda Universitaria Policlinico Università degli Studi di Napoli Federico II, and in accordance with general authorisation to process personal data for scientific research purposes from “The Italian Data Protection Authority”. To assess KRAS MASI, we quantified the KRAS mutant and wild type allelic peak heights on sequencing electropherograms, by the methods previously described by Soh et al.8 To this end, a total of 603 sequencing electropherograms showing a KRAS exon 2 mutant peak in codons 12 or 13 were retrieved from our clinical records.14 To limit the confounding effect of background noise, special care was taken to select only electropherograms with an average Phred Quality Score >20. On the overall, a total of 437 sequencing electropherograms were included in the study for review. Mutations occurred in 353 (80%) samples in codon 12 (G12D n.=145 (41%); G12 V n.=111 (31%); G12C n.=34 (10%); G12S n.=34 (10%); G12A n.=22 (6%); G12R n.=7 (2%)), while 84 (20%) cases harboured a mutation in codon 13 (G13D n.=80 (95%); G13C n.=4 (5%)). Differences between type of mutation and MASI occurrence were assessed using Fisher’s exact test considering a p value ≤0.05 as statistically significant.
To verify whether the above described methodology was accurate in MASI detection, 30 cases showing a KRAS MASI on the sequencing electropherograms review and having sufficient (>50 ng) banked DNA were selected to perform KRAS exon 2 mutational analysis by NGS. To this end, extracted DNA was analysed by using the 454 GS-Junior sequencer (Roche Diagnostics, Mannheim, Germany) at the Molecular Pathology facility of the Bellaria Hospital-University of Bologna, as previously described.15 ,16 KRAS MASI positive samples were defined as those yielding more mutant reads than wild type ones.
Five primary tumours showing KRAS MASI were further investigated to assess whether this phenomenon had a homogeneous or heterogeneous tissue spatial distribution. To this end, in each case, five different tissue areas were sampled by a laser capture microdissector (Carl Zeiss, Palm Microsystems) (figure 1). Each area of at least 150 000 μm2 was independently analysed for mutational status of codons 12 and 13 of exon 2 of KRAS, as previously reported,17 assessing on the corresponding sequencing electropherogram KRAS MASI occurrence.14

Mutant allele specific imbalance (MASI) spatial tissue distribution. Note discordance in KRAS MASI tissue distribution. G13D KRAS MASI occurred in B1 and B2 sequencing electropherograms, whereas A1, A2 and C lacked MASI.
Statistical analysis and MASI clinical significance evaluation
To assess the relevance of KRAS MASI as a prognostic factor, we selected 58 patients, (n=20 positive for MASI; n.=38 negative for MASI), whose clinical data were available. Univariate analysis for overall survival (OS) was performed using the Kaplan-Meier methods. The OS was calculated as the time between the first visit with the oncologist and the last visit or death from any cause of the patient. All analyses were performed using SPSS IBM software (Milan, Italy) considering a p value ≤0.05 as statistically significant.
Cell culture, transfections and pharmacological treatments
To assess whether G13D MASI may influence the in vitro response to anti-EGFR therapy the effect of KRAS MASI on the cetuximab treatment in cell lines models was evaluated. To this end, SW48 colorectal carcinoma cell line was maintained as previously decribed,18 and transfected with Lipofectamine 2000 (Life Technologies, Grand Island, New York, USA) using 0.5 µg and 2 µg of myc-KRAS-G13D and 0.5 µg of myc-KRAS-G12 V plasmid vectors,19 following manufacturer’s suggestions. Cells were treated by cetuximab (Erbitux, Merck Serono, Darmstadt, Germany) for 48 h, in triplicate. Cell viability was evaluated by using the CellTiter 96 AQueous One Solution Cell Proliferation Assay (Promega, Madison, Wisconsin, USA) following manufacturer's instructions.
Results
Frequency and distribution of MASI
In 56/437 (12.8%) cases KRAS MASI was observed. Of these, in 40 cases MASI occurred in codon 12 ((G12D=19 (48%); G12 V=4 (10%); G12S=7 (17%); G12A=6 (14%); G12C=3 (7%); G12R=1 (2%)), whereas 15 cases harboured codon 13 MASI. MASI was more frequently associated with G13D mutation (p=0.05).
The comparative analysis of KRAS MASI detection by Sanger Sequencing and NGS showed 94% (28/30) concordance. Only two cases (6%) showing KRAS MASI by Sanger Sequencing had discordant result by NGS.
Data relative to the independent assessment of laser microdissected different tissue areas from five single tumours are reported in table 1. Only in one instance (case 5) KRAS MASI was observed in all selected areas. Conversely, the other four cases analysed showed concurrent MASI positive and negative tissue areas (figure 1).
Masi Tissue Spatial Distribution
Evaluation of the clinical significance of MASI
The Kaplan-Meier curve relative to the comparison in OS between the groups of patients with KRAS MASI (n=20; OS: 74.1; 95% CI 15.1 to 133.1) and without (n=38; OS: 172.1; 95% CI 163.0 to 181.3) is shown in figure 2. The longer OS in the KRAS MASI negative patient group did not reach statistical significance (p=0.08).
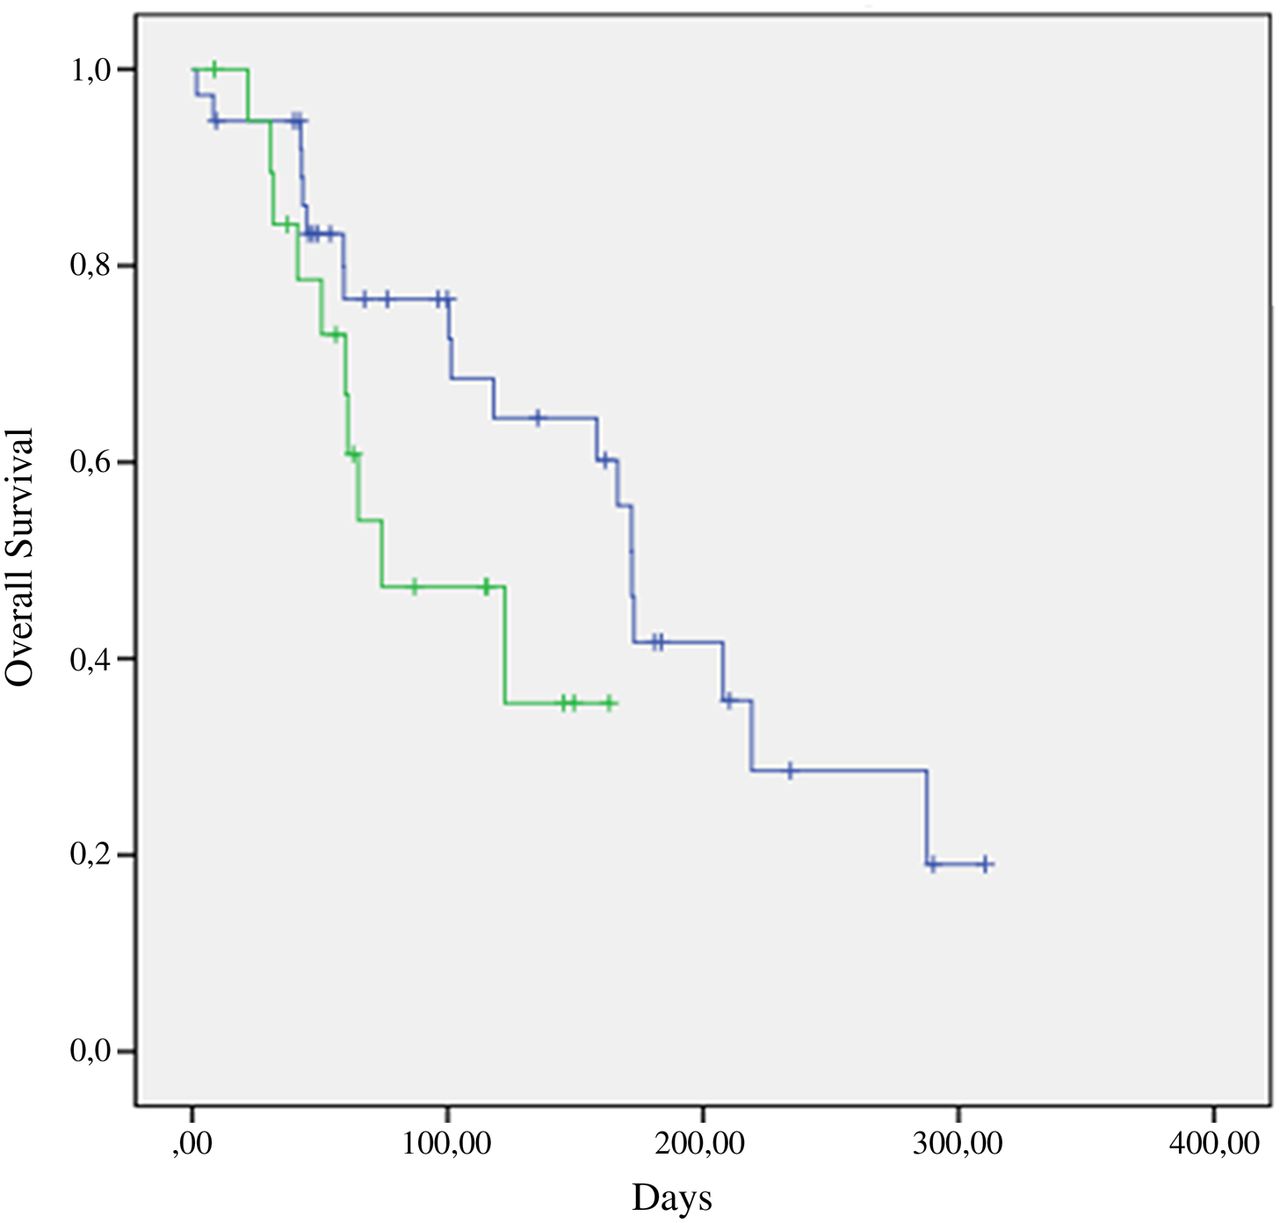
Kaplan–Meier overall survival curves compared the group of patients with mutant allele specific imbalance (MASI) (green line) against the one without (blue line). The difference between the two groups of patients did not reach the statistical significance (p=0.08).
Measurement of cetuximab sensitivity in G13D cell line harbouring different MASI status
To evaluate the effect of KRAS MASI G13D on cetuximab treatment, SW48 cells were transfected with increasing amount of myc-KRAS-G13D plasmid vector, using as a control, cells were transfected by 0.5 µg of myc-KRAS-G12 V plasmid vector. The enforced expression of myc-KRAS-G13D, compared with KRAS G12 V transfected cell lines conferred dose dependent resistance to cetuximab treatment (figure 3).

The effect of myc-KRAS-G13D transfection on SW 48 cell line viability. Note that the enforced expression of myc-KRAS-G13D vector increases the percentage of cell viability. Myc-KRAS-G12V transfected cells were used as a control. MASI, mutant allele specific imbalance.
Discussion
In this study, in addition to confirm that KRAS MASI is not uncommon, several new findings were presented. Previously, Hartman et al9 found MASI in 19.7% of KRAS mutated CRCs. This is not dissimilar from our series rate of 12.8%. Also similar to Hartman, KRAS MASI was more frequently observed in association with G13D mutation (p=0.05). Detection of MASI of an oncogene requires, besides the detection of a mutation, the determination of the relative mutant and wild type allele ratio.8 Previous studies have consistently measured mutant allelic peak height on the sequencing electropherograms.9 ,10 ,12 Soh et al8 showed that this method is as accurate as subcloning to quantify the relative ratio between mutant and wild type allele. Thus, the simple review of diagnostic sequencing electropherograms avoids laborious and time-intensive subcloning, making it possible to identify MASI in clinical practice.9 ,10 Indeed, this approach has been exploited in several studies that investigated the relevance of oncogenic MASI in lung,10 ,20 ,21 pancreatic11 and colon9 carcinomas for a number of oncogenes including KRAS10 ,11 ,20 and EGFR.21 More recently, NGS is replacing Sanger Sequencing to identify clinical actionable mutations in many diagnostic settings.22 ,23 Moreover, NGS allows for a highly accurate quantitative assessment of mutant allele in solid tumours.13 To date, NGS has not been employed to investigate MASI. In this study, we showed that in most cases (94%) the identification of MASI by NGS is concordant with that by direct sequencing electropherograms review. Only in 6% of cases MASI identified by Sanger sequencing was not confirmed by NGS. Limits of Sanger Sequencing partly depend on the specific mutation detection and on the different intensities of fluorescent emissions related to different nucleotides.
In previous studies, KRAS MASI was exclusively evaluated on DNA extracted from a whole paraffin section of neoplastic tissue, without taking into account different areas of the same tumour.10 ,11 ,20 In this study, we investigated whether MASI has a homogeneous or a heterogeneous tissue distribution. To avoid dilution of mutant allele into benign tissue-derived DNA, neoplastic-rich areas were sampled by laser capture microdissection. Using this approach we demonstrated that KRAS MASI has an uneven tissue distribution (figure 1). Thus, while KRAS mutation is an early event in colorectal tumours,7 it can be argued that KRAS MASI may be related to clonal selection during tumour progression. A discordant KRAS mutational status between primary tumour and the corresponding metastasis is not exceptional, when using a less sensitive technique.7 From a technical standpoint it can be argued that the occurrence of MASI during tumour progression may lead to a different number of mutant allele between the primary and the metastatic sites.
Hartman et al9 showed that KRAS MASI positive patients with CRC have a worse prognosis. Similar evidence was reported for lung10 and pancreatic11 neoplasms. Our data showed longer OS of KRAS MASI negative patients. However, this finding is not statistically significant (p=0.08). Our retrospective study analysed a large number of routine sequencing electropherograms, but it was not specifically designed to establish the impact of KRAS MASI on the OS in a large cohort of patients with CRC.
The response of patients with CRC harbouring KRAS G13D mutation to anti-EGFR is currently being investigated. Hartman et al suggested that ongoing clinical trials on anti-EGFR therapy in KRAS p.G13D-mutated CRC should take into account KRAS MASI status. We evaluated in vitro the effect of KRAS MASI on cetuximab treatment. Our results showed that the enforced expression of KRAS G13D mutation, using as a control G12 V mutation, was able to confer resistance to treatment with cetuximab in a dose-dependent manner (figure 3), strongly supporting the idea that allelic imbalance could be responsible of the observed resistance. Interestingly, Valtorta et al24 using preclinical models and patients’ samples recently reported that the emergence of KRAS amplification is associated with acquired resistance to the EGFR inhibitors.
In conclusion, this study confirmed that KRAS MASI is significant in CRC. Among codon 12 and 13 KRAS mutations, MASI is specifically associated with G13D mutation, and this may play a role in predicting the response to EGFR inhibitors. KRAS MASI may be a late event in tumour progression, as suggested by its heterogeneous spatial distribution. Future studies designed to assess KRAS MASI in larger cohorts of patients, in prognostic and predictive terms, may exploit NGS as an investigational tool.
Take home messages
-
KRAS mutant allele-specific imbalance (MASI) can be identified when the mutant allele peak is higher than the wild type one on the sequencing electropherogram.
-
KRAS MASI is not infrequent and it has a heterogeneous intratumoral distribution. It is more commonly associated with the G13D mutation.
-
The in vitro model showed that KRAS MASI represents a mechanism of resistance to cetuximab treatment.
References
Supplementary materials
Abstract in Italian
This web only file has been produced by the BMJ Publishing Group from an electronic file supplied by the author(s) and has not been edited for content.
Files in this Data Supplement:
- Abstract in Italian - Online abstract
Footnotes
-
Handling editor Runjan Chetty
-
Contributors UM and GTr: conceived and designed the experiments; UM, RS and DdB: performed the experiments; UM, GTr, ADS, CC, EV, PP, CB, RS and GTa: analysed the data; UM, EV, CB, PP, GTa and GTr; contributed to the writing of the manuscript.
-
Competing interests None.
-
Patient consent Obtained.
-
Ethics approval Institutional Review Board, Carlo Romano.
-
Provenance and peer review Not commissioned; externally peer reviewed.