Article Text

Abstract
Aims To build and evaluate an automated method for assessing tumour viability in histological tissue samples using texture features and supervised learning.
Methods H&E-stained sections (n=56) of human non-small cell lung adenocarcinoma xenografts were digitised with a whole-slide scanner. A novel image analysis method based on local binary patterns and a support vector machine classifier was trained with a set of sample regions (n=177) extracted from the whole-slide images and tested with another set of images (n=494). The extracted regions, or single-tissue entity images, were chosen to represent as pure as possible examples of three morphological tissue entities: viable tumour tissue, non-viable tumour tissue and mouse host tissue.
Results An agreement of 94.5% (area under the curve=0.995, kappa=0.90) was achieved to classify the single-tissue entity images in the test set (n=494) into the viable tumour and non-viable tumour tissue categories. The algorithm assigned 250 of the 252 non-viable and 219 of the 242 of viable sample regions to the correct categories, respectively. This corresponds to a sensitivity of 90.5% and specificity of 99.2%.
Conclusions The proposed image analysis-based tumour viability assessment resulted in a high agreement with expert annotations. By providing extraction of detailed information of the tumour microenvironment, the automated method can be used in preclinical research settings. The method could also have implications in cancer diagnostics, cancer outcome prognostics and prediction.
- AUTOMATED SCREENING
- DIGITAL PATHOLOGY
- tumour necrosis
- LUNG CANCER
- IMAGE ANALYSIS
This is an Open Access article distributed in accordance with the Creative Commons Attribution Non Commercial (CC BY-NC 4.0) license, which permits others to distribute, remix, adapt, build upon this work non-commercially, and license their derivative works on different terms, provided the original work is properly cited and the use is non-commercial. See: http://creativecommons.org/licenses/by-nc/4.0/
Statistics from Altmetric.com
Introduction
Tumour viability is an important endpoint in xenograft models, tumour slice grafts, tissue cultures ex vivo and for pre-analytical quality control of archived tissue samples in biobanks.1 There is no specific biomarker for tissue viability, and the current predominant method for the assessment of tumour viability is visual examination of H&E-stained tissue sections by light microscopy. However, visual interpretation can lack objectivity and the measurements are difficult to reproduce. Hence, more precise and replicable methods for assessing tumour viability in histopathological samples are needed.2 In addition, the methods should have the capability to handle data from whole-slide microscopy scanners and be applied to large sample series.
Xenograft tumour models are widely used in preclinical studies investigating neoplastic transformation, metastatic invasion and in screening for novel antitumour drugs.3 Antitumour activity of the tested agents is often assessed by endpoints such as tumour viability, tumour doubling time, tumour growth delay and proliferation.4
In this study, we propose an image analysis-based tissue segmentation method for assessment of tumour viability in human lung cancer xenografts. The segmentation includes separation of tumour tissue from other tissue morphologies (eg, stroma, muscle and adipose tissues). The method then further identifies and quantifies viable tumour and non-viable tumour tissue (eg, necrotic tumour tissue). In the viability analysis, the non-tumourous tissue regions are removed and the tumour viability is measured as a percentage of viable tissue in the tumour region only. The proposed method uses texture features to discriminate among the different tissue morphologies. Texture features have been broadly applied in computer vision,5 and in digital pathology, for example, to identify and separate epithelium and stroma in histological images,6 ,7 to map dysplastic fields in colorectal tissue8 and to identify follicles in immunohistochemical samples.1
Few prior studies have been published regarding image analysis of tissue viability or necrosis in whole-slide images (WSIs). One study9 used a combination of texture and colour features to detect necrotic tissue in WSIs of non-cancerous rat liver. In addition, another study10 noted an association between morphological features and necrotic tissue in ovarian serous carcinoma, but did not attempt to discriminate between stroma and necrosis. In ref.,11 a method based on unsupervised feature learning using a sparse autoencoder was applied for identifying necrosis in WSIs of glioblastoma multiforme and clear cell renal cell carcinoma.
We developed an image analysis method for the segmentation of tissue into viable and non-viable tumour tissue for the purpose of assessment of drug response in xenograft tissue. The proposed assessment was developed and validated on H&E-stained sections of mouse xenografts of human non-small cell lung cancer (NSCLC). To identify different tissue morphologies, we used texture descriptors derived from local binary patterns (LBPs) and a local contrast measure (VAR) in combination with a support vector machine (SVM) classifier. The developed method visualises the spatial distribution of non-viable regions in a tumour as a heat map and produces a numerical value for the overall viability of a tumour.
Methods
Cell culture and tumour assay
The human NSCLC adenocarcinoma cell line NCI-H460-LNM3512 was maintained in RPMI-1640 medium supplemented with 2 mM glutamine, penicillin (100 U/mL), streptomycin (100 μg/mL) and 10% fetal calf serum (Promocell, Heidelberg, Germany). Tumour cells (5×10⁶ cells per mouse) were implanted subcutaneously into nu/nu BALB/c mice (Harlan Laboratories, Venray, The Netherlands) anaesthetised with ketamine (Ketalar; Pfizer, New York, New York, USA) and xylazine (Rompun vet; Bayer Healthcare, Leverkusen, Germany). At 4 days after tumour implantation, the mice were randomly assigned to receive an intraperitoneal injection of the antiangiogenic compounds, or control human immunoglobulin G. Once the largest tumour diameter reached 19 mm in length, the mice were sacrificed and the primary tumours were excised, cut in halves and fixed with 4% paraformaldehyde. The paraffin-embedded tumour tissues were cut into 5–7 μm sections, and then stained with H&E.
Tissue scanning
The H&E-stained tumour samples were digitised with an automated whole-slide scanner (Pannoramic 250 FLASH, 3DHISTECH, Budapest, Hungary) using a Plan-Apochromat 20× objective (numerical aperture 0.8) and a VCC-F52U25CL camera (CIS, Tokyo, Japan) equipped with three 1224×1624 pixel charge coupled device sensors. The pixel size of the sensors is 4.4×4.4 μm. In combination with the 20× objective and a 1.0 adapter, the image resolution is 0.22 μm/pixels. Images were compressed to a wavelet file format (Enhanced Compressed Wavelet, ECW, ER Mapper, Intergraph, Atlanta, Georgia, USA) with a compression ratio of 1:9. The compressed virtual slides were uploaded to a WSI management server (WebMicroscope, Fimmic, Helsinki, Finland). WSIs on the server can be viewed via a browser and accessed with image analysis tools (eg, ImageJ and MATLAB).
A total of 72 WSIs were scanned, and after an image quality check, a subset of 56 WSIs with minimum out-of-focus areas were chosen for further analysis. The average size of an analysed image region in the WSIs was 7.6 gigapixels (range 1.4–10). As an example, a tumour with a diameter of 19 mm corresponds to an image width of 86 000 pixels.
Annotation of homogeneous image regions
Two sets of single-tissue entity images (STEI) (945×945 pixels each) were selected and cropped from the WSIs to be used in the training and testing of the algorithm, respectively. The STEIs are selected from homogeneous tissue regions, that is, regions representing only one of the tissue morphologies of interest (figure 1).
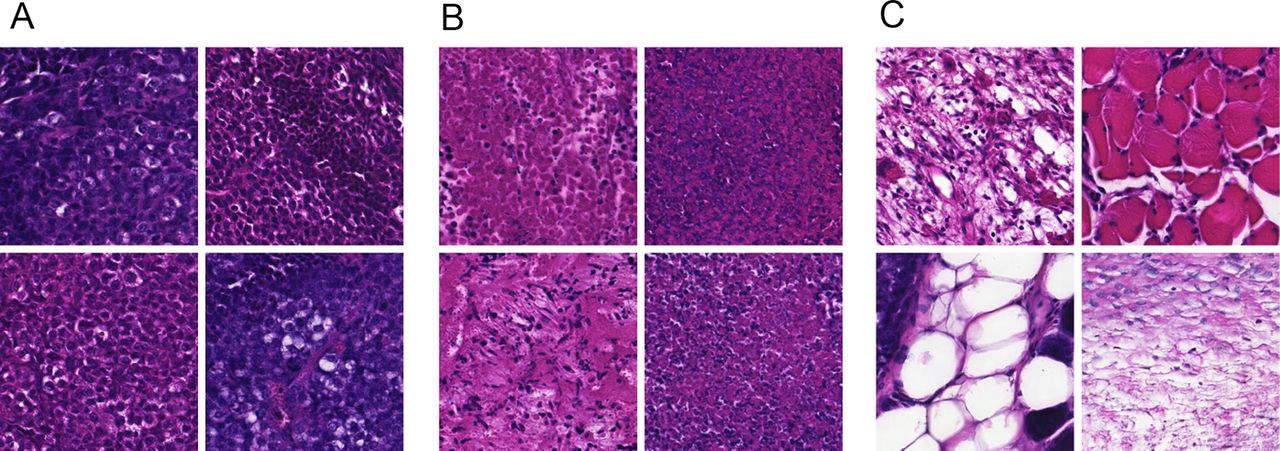
Set of example images of selected representative tissue regions. (A) Viable tumour tissue, (B) non-viable tumour tissue and (C) mouse host tissue (eg, stroma, muscle and adipose).
For the training set (n=177), STEIs were extracted from viable tumour tissue (n=57), non-viable tumour tissue (n=52) and from of mouse host tissue (n=68), for example, stroma, muscle and adipose tissue. The training set was extracted from four WSIs that were not used when testing the method. For the test set (n=494), STEIs were selected only from viable tumour (n=242) and non-viable tumour regions (n=252). The test set was extracted from 23 WSIs. All the STEIs were selected by one of the researchers (NL).
Annotation of WSIs
In addition to the above-described image sets, two researchers (NL and TH), both physicians with a strong background in molecular biology, manually annotated regions of viable tumour and non-viable tumour in the WSIs. These annotations were used for evaluating the automated assessment on a sample level. Two masks were drawn for each of the 52 samples, one mask identifying the whole xenograft tumour and another mask for labelling the non-viable tumour tissue but excluding mouse host tissue (eg, stroma, adipose and muscle). A graphics-editing program (Adobe Photoshop CS6, Adobe Systems, Mountain View, California, USA) was used to draw the masks on the downscaled (4.16 μm/pixel) versions of the original WSIs. During the process of drawing the masks, the full-resolution WSIs were available in parallel for viewing to better visualise the tissue morphology.
Automated viability assessment
The proposed method for analysis of WSIs comprises three levels of scales: (1) sample level—this level includes the whole sample and the tumour viability is measured on this level. (2) Tile level—the samples are divided into smaller images, that is, tiles and STEIs, which are simpler to process and annotate compared with an entire WSI. (3) Window level—the tiles are further divided into overlapping regions, called windows, which are processed individually. The size of a whole sample is measured in gigapixels, and the tiles and the windows are measured as megapixels and kilopixels, respectively. The proposed segmentation method was implemented with an image-processing framework (MATLAB, MathWorks, Natick, Massachusetts, USA). Figure 2 illustrates how different data sets are used in the training and testing phase and what computational components they include.

Flow chart of the main principle of the tumour viability assessment. The support vector machine (SVM) model is trained and optimised with the training set of single-tissue entity images (STEI), representing the different tissue categories of interest. The discrimination of the model is evaluated in parallel in test set of STEIs and in whole-slide images (WSIs). On the test STEI set, the agreement to classify a test image into viable or non-viable tumour category is evaluated by comparing result to manual labelling. Similarly on the WSI test set, the agreement in tissue segmentation and finally tumour viability assessment are evaluated by comparing obtained results with expert annotations.
Prior to the tile division, the images were downscaled to pixel size of 0.44 μm and converted into grey scale by weighting the colour channels with a vector: [0.2989 0.5870 0.1140]T. The tiles were not overlapping and the maximum size of a tile was set to 3968×3968 pixels. The size of each extracted window was set to 128×128 pixels, and read every 64th pixel, thus creating an overlap of 50% for every subsequent window.
The LBP and VAR descriptors are parameterised based on the size of the neighbourhood and by the LBP code mapping.13 Two LBP/VAR joint distributions were obtained from the grey-scale converted windows; the first with parameters  and the second with parameters
  . The subscripts [(3,8), (4,16)] define the used perimeter (P) and radius (R) pairs: (P, R), and the superscript riu2 defines the applied code mapping, that is, rotation invariant 2-uniform.13 ,14 The parameter values were selected based on our previous experience and preliminary tests.
A combination of a multiclass linear SVM and a sparse feature mapping was used to classify the windows into the three target categories according to the obtained LBP/VAR descriptors. For the classification, an L2-regularised L2-loss SVM15 multiclass (one vs rest) classifier was used. In order to boost the discrimination of the linear model, a sparse feature mapping16 was applied to the features. An open-source library for computer vision algorithms17 was applied for a feature mapping approximating the χ2 kernel. The combination of linear SVM and sparse kernel approximation was selected to enable efficient large-scale learning and complex non-linear modelling.
After the classification of all the windows of a WSI, the classification results were merged together into a result image by averaging the overlapping decision scores and applying a Gaussian filtering for final refinement. In a result image, the tumour region was first identified by majority voting (selecting the strongest decision value), after which a heat map visualising viable and non-viable tumour regions was drawn on top of the detected tumour as a separate layer. The heat map is a probability map, visually representing the classifier's classification confidence; blue for viable tumour tissue and red for non-viable tissue.
Model optimisation and training
The 177 training images were divided into windows using the parameters described earlier (128×128 pixels, read every 64th pixel), resulting in a total of 6372 individual training windows.
A threefold cross-validation was used to optimise the cost parameter C of the SVM classifier. The folds were balanced regarding the number of windows per class by randomly selecting as many samples to each fold. Parameter values of [2−10, 2−9.5, …, 2−11.5, 212] were used in the validation, and the value that resulted to the highest average accuracy was selected for training the final SVM model. The selected parameter value was C=8 and the average cross-validation accuracy was 97.5%. Similarly to validation, as many training windows were randomly selected from each tissue category for training the final SVM model. In total, 5616 windows were used to train the model.
Statistical analysis
The agreement of the method is evaluated by comparing the obtained results with expert annotations and calculating percent agreement, kappa-statistics and the area under the receiver operating characteristic curve (AUC) for the STEI test set. In addition, the results were evaluated on the WSIs based on per cent agreement on pixel level (agreement in segmentation) and by Pearson's product-moment correlation on a sample level (agreement in tumour viability assessment).
Results
The proposed method was evaluated on two separate image sets, that is, the STEI test set and the WSI test set (figure 2). The STEI test set contains single-entity regions, that is, images representing homogeneous areas of viable and non-viable tumour tissue, and the WSI test set is a collection of digitised whole tumours. The WSIs are challenging to annotate with high precision, whereas extraction of smaller single-entity images can be done with higher accuracy. This makes the STEI test set more precise as a reference for evaluation of how well the method can discriminate between viable and non-viable tissue. Additionally, the proposed approach was compared to a standard classification method: nearest neighbour (NN).18 On the WSI test set, we evaluate both agreement in segmenting the different tumour tissue morphologies and the agreement in assessing the tumour viability.
Discrimination between viable versus non-viable tumour tissue in STEIs
The test STEI set images were divided into windows (128×128 pixels, read every 64th pixel) and classified according the dominant tissue category. The proposed method resulted in an agreement of 94.5% (AUC=0.995 and a kappa value of 0.90 (CI 95% 0.86 to 0.97)) to classify the 494 test STEIs (viable tumour n=242 and non-viable tumour n=252) into the respective categories (figure 3). Only two test images belonging to the non-viable tumour category were misclassified; one as viable tumour and one as non-tumourous. Twenty-three images representing viable tumour were incorrectly classified into the non-viable category. This corresponds to a sensitivity of 90.5% and specificity of 99.2% to distinguish viable from non-viable tissue. A comparison of the suggested approach to an NN classifier using the same features is shown in table 1.
Performance of the support vector machine (SVM) and nearest neighbour (NN) classifiers to discriminate between viable versus non-viable tissue in the test single-tissue entity images set

Discrimination performance between viable and non-viable regions in single-tissue images. (A) Confusion matrix illustrating the agreement between the human observer annotations and the tissue categories assigned by the image analysis method. (B) Discrimination of the tissue samples by the classification score. (C) Receiver operating characteristics curve and corresponding area under the curve (AUC).
Assessment of tumour viability in WSIs
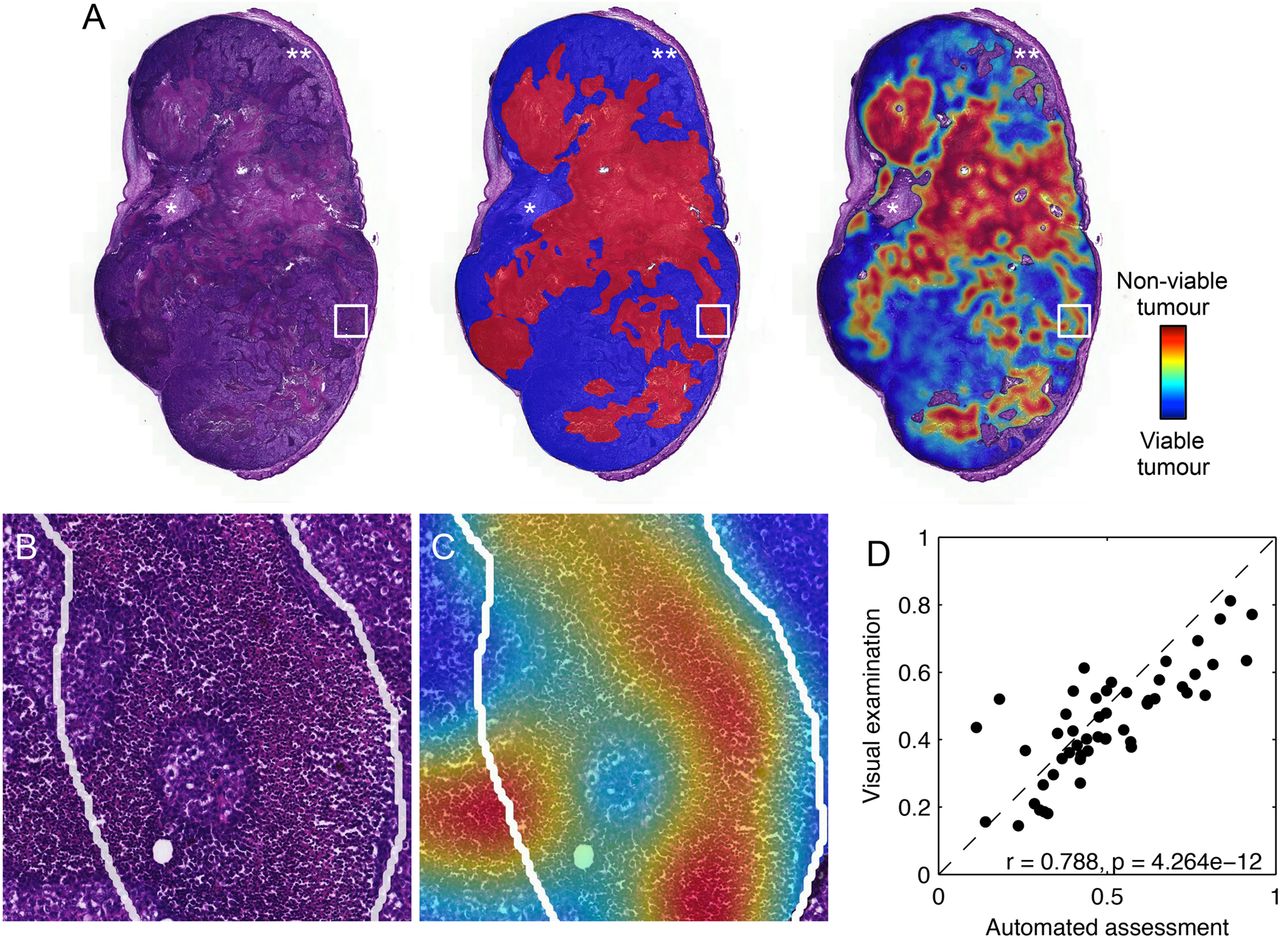
An average agreement of 83.3% was achieved in segmentation of WSIs into viable and non-viable tumour regions on a pixel level compared with the expert annotations. On average, 39.4% of the tumour area was segmented as true viable tumour, 43.9% as true non-viable tumour, 5.6% as false viable tumour and 11.0% as false non-viable tumour. The correlation between the automated tumour viability assessment and expert readouts was r=0.79 ( 95% CI 0.66 to 0.87, p<0.0001) on the sample level in the set of 52 WSIs (figures 4 and 5). On average, 11.4% of the manually drawn tumour masks were classified as non-tumourous tissue and excluded (7.3% from viable tumour tissue and 4.1% from non-viable). These regions mostly correspond to sparse tissue regions, stroma and tissue folds.

Tumour viability assessment in whole-slide images of human lung cancer xenografts stained with H&E. (A) Original sample (left), manually annotated sample (middle) and a result image (right). The tumour regions were identified by manually marking the viable (blue) and non-viable (red) tumour regions. In the result image, a heat map is visualised on top of the automatically identified tumour. The same colour coding is used; blue for predicted viable tumour and red for predicted non-viable tumour tissue. *An example of a region where stromal tissue was not identified by a human expert during the annotation but correctly excluded by the segmentation, and **an example of a region where viable tumour was falsely excluded. (B) An example of manual annotation (white line) in finer detail in the original sample. (C) An example of manual annotation (white line) in finer detail in the result image. (D) The correlation between visual examination and the automated assessment for measuring tumour viability.

Result images for all the 52 whole-slide images used in validation of the assessment of the image analysis algorithm with pie charts showing the obtained tumour viability readout.
Discussion
In this study, we developed a texture-based tissue classifier for assessing tumour viability in mouse xenografts of human NSCLC. The high agreement (AUC=0.995) between the algorithm and the human observer in discriminating between the tumour tissue morphologies shows that computerised quantification of tumour viability in xenograft samples is feasible. Together with the introduction of whole-slide digital scanners and the growth of computational power, computer-assisted tools are good candidates for automated segmentation of tumours within experimental cancer research.
Cancer drug research largely relies on the study of models such as mouse xenografts of human tumours. Xenografts are one of the most frequently used models in preclinical testing of therapeutic targets for cancer treatment. Accurate characterisation of how the tissue morphology, for example, tumour viability, in xenografts and ex vivo cultures of human cancer tissue is modulated by, for example, cytotoxic drugs, targeted therapies or ionising radiation, is important for assessment of drug response. An automated and reliable readout of morphology would allow more accurate intralaboratory and interlaboratory comparisons of treatment outcomes. In addition, tissue viability is an important endpoint for quality control of samples stored in biobanks, and a method for analysing the viability of the tissue in this setting would be useful.1 Computer vision applications routinely extracting and analysing image features from histological samples are good candidates for totally automating and offering a decision support for an expert in these processes.
The image features used in the current study are based on LBPs, which are rotation and grey-scale invariant texture descriptors. The LBP descriptor and its variants are used in a broad range of pattern classification tasks such as biometric applications for face recognition,19 iris recognition20 and fingerprint identification.21 The LBP descriptor has been proven to be highly discriminative and computationally efficient.22
Previous studies on classification of morphological entities in biological samples using LBP features have been reported. For example, an approach using LBP descriptors to determine tissue as either stroma-rich or stroma-poor in digitised WSIs of neuroblastoma reached an overall classification accuracy of 88%.23 A method assessing for discriminating between epithelium and stroma in digitised tissue microarrays of colorectal cancer using LBP features reached an accuracy of 99% and AUC=0.995.6
Other texture features such as Haralick descriptors have also been used for classification of tissue morphologies, stromal and cancerous tissue in sections of prostate cancer, providing a classification accuracy of 79% of the subregions in digitised samples.24
Only few previous studies on the use of texture analysis, or other image analysis approaches, for assessment of tissue viability in WSIs have been reported. A multiscale method to quantify WSIs of non-cancerous rat liver into viable, necrotic or background evaluating different feature combinations and classifier settings has been presented.9 In that study, pixel value statistics and LBP descriptors were extracted from a set of colour channels and classified using a random forest classifier with an average segmentation accuracy of 94.67% on four different WSI sets. This study was, however, not focused on tumour samples. In another study, biologically relevant image features were investigated and a high nuclear eccentricity was identified as a characteristic feature for both stroma and necrosis in ovarian serous carcinoma, but classification accuracy was not evaluated.10 Additionally, the applicability of sparse autoencoder for unsupervised feature learning to identify necrotic regions in WSIs was studied in ref.11 An accuracy of 84% was obtained in the glioblastoma multiforme and 81% in the clear cell renal cell carcinoma data set.
An obvious challenge for the development and testing of automated quantification tools is sample annotation and production of precise ground truth data on the sample level. Manual annotation of a set of gigapixel-sized WSIs is a challenging task to perform with a high precision. This was also recognised in the current study, where a part of the lower performance in the WSIs compared with the selected STEIs could be explained by less stringent annotations. When further inspecting erroneously classified areas in detail, it often turned out that the proposed method result actually was correct and that small areas of necrosis or viable tissue had been missed during annotation of the gigapixel images (figure 5). Precise manual annotations for the WSIs are challenging to produce due to their large size and complex morphology. The challenging nature of manual annotation on the sample level also demonstrates the need for more accurate and efficient methods for quantifying tissue morphologies. The STEI sets were created in order to have a more controlled, or pure, subset of the data representing the tissue categories. Additionally, training the method using the STEI samples minimises the problem of having wrongly labelled examples in the training set. A disadvantage of the STEI set is the more limited sample areas covered compared with WSIs, and thus there is a possibility of STEIs not being as representative of the entire samples.
The lack of publicly available validation data makes the cross-comparison of published work uncertain. Some of the previously presented studies on tissue analysis validate the methods by evaluating the algorithms on fixed-size-annotated areas.9 ,23 In the current study, we measured the agreement both on single-entity images and on WSIs to study the agreement in assessing tumour viability on a sample level.
The used LBP/VAR texture descriptors are known to be sensitive to image blurring. One solution to overcome this would be to train the classifier also with blurred images either by selecting poorly focused regions as part of the training set or by simulating the blurring effect with a low-pass filter. Another approach would be to use descriptors such as local phase quantisation, which might offer robustness against blurring.25 In the current study, we performed a quality check of the WSIs prior to image analysis and decided not to include samples with out-of-focus areas.
Mouse xenografts for human cancers are widely used in models of tumour invasion and metastasis, malignant transformation and response to therapy. The material used in this study was composed of microscopy images of NSCLC xenograft tumours from mice treated with a set of antiangiogenic compounds. Since the mice used in the xenograft models are immunocompromised, the microenvironment of the implanted human tumours is not histologically representative of the human tumour microenvironment. Hence, retraining of the classifier before applying it to images from patient tumours, even when studying the same tumour type, is likely needed. Similarly, retraining would be required before applying the method to a different tissue or cancer type.
In addition to the segmentation of the tumour tissue described in this study, a tumour viability classifier could be studied for cancer outcome prediction.26 For example, the quantity of tumour necrosis/non-viable tumour is often an indicator of an aggressive tumour phenotype and associated with unfavourable survival in several tumour types, including breast,27 colorectal28 and NSCLC,29 as well as renal cell carcinoma.30 Further studies are needed to evaluate the use of the proposed algorithm for quantification of necrosis in human tumour samples for prognostic purposes and to study its applicability to the analysis of tumour viability in other tissue types.
Take home messages
Tumour viability is an important factor, but precise assessment is subjective and laborious.
Whole-slide imaging and computer vision methods (digital pathology) can be used to automate and make the tumour viability assessment reproducible.
The proposed approach resulted in high agreement with human opinion.
References
Footnotes
Handling editor Cheok Soon Lee
Contributors RT, NL and JL designed the study. RT wrote and designed the implementation and carried out the computational experiments and the data analysis. TH and KA designed and TH implemented the lab work and animal studies. NL and TH manually annotated the whole-slide images and NL labelled the single-tissue images. RT, NL and TH drafted the manuscript. YW participated in the data analysis and critically reviewed and commented on the algorithm. AG participated in the implementation of the algorithm. ML contributed to the data acquisition and management. JL critically revised and commented on the manuscript and supervised the work. All authors read and accepted the final manuscript.
Competing interests JL and ML are cofounders of FIMMIC Oy, a University of Helsinki's spinout company offering the WebMicroscope product used in this study. JL is a research director at the Institute for Molecular Medicine Finland (FIMM), University of Helsinki. He is also the CSO and shareholder of FIMMIC Oy. ML is a project researcher at FIMM, University of Helsinki and he is the CTO and shareholder of FIMMIC Oy. The emphasis of the paper is the methodology development of automated assessment of tumour viability, which is entirely university/academic exercise and does not financially benefit the company FIMMIC Oy in any way. FIMMIC's product, the WebMicroscope, was used only for data hosting and viewing purposes.
Ethics approval Mice were maintained in the Meilahti Experimental Animal Center according to Institutional Animal Care and Use Committee (IACUC) of the University of Helsinki and Institutional Review Board (IRB) guidelines. The study protocol was approved by The National Animal Experiment Board of Finland (permit number ESAVI/6492/04.10.03/2012).
Provenance and peer review Not commissioned; externally peer reviewed.