Article Text

Abstract
Aims Semisynthetic derivatives of the antimalarial drug artemisinin may also possess anticancer properties. The ability to detect artemisinin uptake and distribution in cells would facilitate live cell imaging without labelling. This study describes mid-range infrared absorption spectra for three artemisinin variants and attempts to detect their presence in a simple cell model (erythrocytes). Cytotoxicity assays assess potential anticancer properties against bladder cancer cells.
Methods Mid-range Fourier transform infrared spectra were obtained from dry preparations of dihydroartemisinin (DHA), artesunate (ART) and artemether (ARTE). Erythrocytes were prepared from normal blood and incubated for 30 min at 37°C with the three artemisinin derivatives. Cytospin preparations were prepared on aluminium foil for spectroscopy. Potential for growth inhibition in the RT112 bladder carcinoma cell line was assessed by the 3-(4,5-dimethylthiazol-2-yl)-2,5-diphenyltetrazolium bromide residual viable biomass method.
Results Spectra were obtained from the three native compounds. Repeat scans after 8 weeks showed ART and ARTE to be stable, stored under manufacturer's recommendations. DHA exhibited marked changes over the same period. It was possible by subtraction to detect DHA in cytospins, but not ART or ARTE. The fit between the subtraction spectrum and that of the native compound was >80%. DHA and ART showed strong cytotoxic potential against RT112 cells.
Conclusions The artemisinin derivatives tested exhibit unique mid-range infrared absorption spectra which can be used to monitor degradation and, for DHA, can be detected by subtraction in loaded erythrocytes rendering future imaging studies feasible. Its cytotoxic efficacy against RT112 cells suggests bladder cancer as a possible target disease.
- ANALYTICAL METHODS
- ERYTHROCYTE
- BLADDER
- CANCER
- CELL BIOLOGY
Statistics from Altmetric.com
Introduction
Artemisinin is derived from the sweet wormwood plant Artemisia annua L. and has a long history of use in Chinese medicine to treat febrile conditions.1 It is a key component of the WHO's global antimalaria strategy, its derivatives representing a class of highly potent antimalarial drugs. Following success against malaria, originally under the Chinese name, Qinghaosu2 and subsequently as artemisinin,3 researchers began investigating whether artemisinins held potential anticancer properties. Early reports demonstrating that artemisinins were cytotoxic to tumour cells include experiments with neuronal cells4 and a range of cancer cells.5 Subsequent studies have demonstrated growth inhibition, increased levels of oxidative stress, enhanced apoptosis and inhibition of angiogenesis on exposure to these drugs.6–8 Some of these properties and mechanisms are outlined below.
Artemisinins are lipophilic and can cross erythrocytic, parasitic and host cell plasma membranes9 as well as cytoplasmic membrane-bound organelles such as mitochondria.10 The mechanism of artemisinins' activity is known to be dependent on the Fe2+-mediated oxidisation of the atypical endoperoxide bridge.11 In nucleate cells, artemisinins induce apoptosis by a Reactive Oxygen Species mediated activation loop among caspases 8 and 912 and optionally also caspase 3.13 Semisynthetic artemisinin derivatives have been formulated to increase solubility and bioavailability in vivo. However, artemisinins are metabolised quickly, so while their rapid activity makes them effective against malaria, the use of artemisinin for cancer treatment/antiangiogenesis treatment may be limited by its fast elimination from blood plasma, unless slow release or combination strategies14 can be developed.
Current malarial therapies and investigations into potential anticancer properties are based on the derivatives dihydroartemisinin (DHA), artesunate (ART) and artemether (ARTE).15 An aid to research in this area would be an ability to image cellular uptake and distribution in real time, as demonstrated with fluorescence labelling.10 This prompted us to design a laboratory-based study investigating artemisinin identification by Fourier transform infrared (FT-IR) spectroscopy, offering a label-free reporting system. These initial studies use a relatively simple erythrocyte model, but may represent the beginning of a body of work that ultimately facilitates live cell FT-IR imaging of neoplastic epithelial cells treated with native artemisinin derivatives, enabling a clearer understanding of their uptake, trafficking and metabolism and hence their potential value as adjuvant components of targeted cancer therapies.
Materials and methods
In vitro analysis of raw materials
DHA was packaged in foil and stored below 5°C according to the manufacturer's instructions. The ART and ARTE derivatives were indicated for storage in plastic at room temperature. FT-IR spectroscopy was conducted for each artemisinin derivative using a FT-IR Nexus Analyser (Thermo Nicolet, USA) and interpreted by OMNIC (V.6.1) software. A background signal was collected and subtracted from sample signatures. For analysis of the compounds ex vivo, enough crystals to adequately cover the diamond within the sample inlet were held securely in place by a metal clamp. A spectrum was acquired on screen within 1 min. The resultant plots showed the absorption and wave number of the peaks identified. These were compared with patterns characteristic of specific bonds to determine if a unique spectrum for artemisinin derivatives could be identified using information from the following online sources, Byrd16 and the Chemical Education Digital Library.17
Incorporation of DHA into viable erythrocytes and its identification in situ
Enucleate erythrocytes were used to pilot in vivo detection, being a simple cell type, as well as relevant to the original use of the drugs. They were obtained from a finger-prick into 10 mL phosphate-buffered saline (PBS) and washed twice by centrifugation. The artemisinin derivatives ART, DHA and ARTE were used. Each derivative (0.2 g) was dissolved into 2 mL of absolute ethanol. Each artemisinin stock solution (20 μL) was added to 2 mL of erythrocytes in PBS, and 2 mL was kept as control. These were incubated with the derivatives for 30 min in a cell culture incubator (37°C, 5% CO2 in humidified air). They were then centrifuged at 1200rpm for 5 min. The supernatant was removed and the cells were resuspended in PBS and recentrifuged. The resulting pellet was used to prepare cytospin slides.
Labelled slides were wrapped in aluminium foil, shiny-side-out and placed in a cytospin centrifuge (Cytospin 4, Thermo Scientific, UK). The erythrocyte pellets were added to the sample inlets on the cytospin filter and centrifuged at 1000 rpm for 5 min. Slides were air-dried before spectra were obtained by forcing the blood spots onto the diamond crystal of the FT-IR analyser. A background spectrum for the aluminium foil was subtracted. OMNIC software was then used to subtract the untreated erythrocyte spectrum from spectra obtained from cells treated with each artemisinin derivative. This provided three subtraction spectra with which to search against online libraries.
Cytotoxicity to epithelial monolayers
Cytotoxicity studies were performed according to the protocols used in previous studies from the group and set out in detail elsewhere.18 Briefly, cells were seeded into 96-well plates, allowed to attach for 24 h, treated with serial dilutions of drug, incubated further for 48 h and the residual viable biomass (RVB) was assessed by the addition of 3-(4,5-dimethylthiazol-2-yl)-2,5-diphenyltetrazolium bromide (MTT) reagent for 2 h before measuring absorbance at 470 nm on a plate-reading spectrophotometer.
Statistical analysis
Statistical analyses were performed using SPSS software (V.19.0 for Windows; SPSS, Chicago, Illinois, USA). Data were normally distributed, thus descriptive statistics are expressed as mean±SEs of the mean. Data were subjected to a one-way analysis of variance, providing an overall figure of significance. In order to ascertain where the differences are and discover trends, the Tukey's post hoc test or Games–Howell test was applied. The conventional p<0.05 value was used as the cut-off for significance.
Results
In vitro results on raw materials
The first spectrum obtained for DHA is shown in figure 1. The very large peak at ∼2450/cm can be ignored as being carbon dioxide interference from the atmosphere. This peak has been blanked out in subsequent spectra. The peak at 3245/cm corresponds to the O–H bond within the DHA molecule, which is added to native artemisinin to form DHA and improve the solubility of the drug. The peak at 2921.95/cm corresponds to C–H bonding. There is a peak at 1750/cm that corresponds to a carbonyl C=O bond indicative of an aldehyde, amide, carboxylic acid or ester. Within the fingerprint region, there are peaks between 180 and 1300/cm; these correspond to the ether, C–O–C bonds within the molecule.

Original dihydroartemisinin (DHA) spectrum (Day 0). Fourier transform infrared spectrum of DHA crystals on aluminium foil. The large peak at ∼2450/cm is considered to be interference from carbon dioxide in the atmosphere and has been blanked out in subsequent spectra.
A new spectrum was obtained for DHA 52 days after the first; changes had occurred as shown in figure 2. The OH region became broader and formed a doublet, usually seen when a molecule contains both O–H and N–H bonding, which DHA should not. This change is indicative of degradation and may be due to moisture reacting with the O–H bonds during storage. Spectra for ART and ARTE were subsequently obtained 14 days later (Day 66). They do not display such differences. Sample spectra are shown in figures 3 and 4.

Spectra for dihydroartemisinin obtained on Day 52. Considerable changes have occurred since Day 0, notably the OH region broadening into a doublet, indicating O–H and N–H bonding.
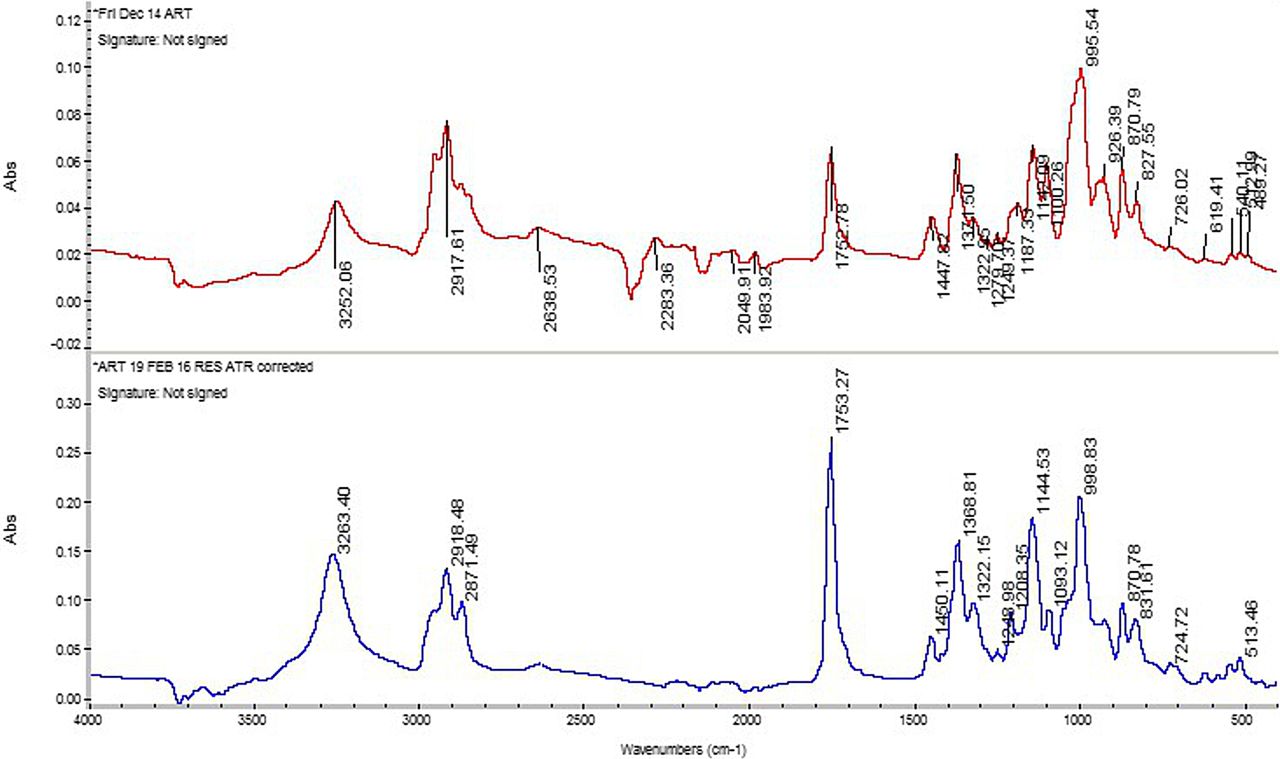
Fourier transform infrared absorption spectra for artesunate (ART). Two spectra are shown, obtained on Day 0 (upper) and the following Day 66 (lower). The spectra do not have the degree of change seen with dihydroartemisinin. There is some change in the C–H bond section just under 3000/cm.
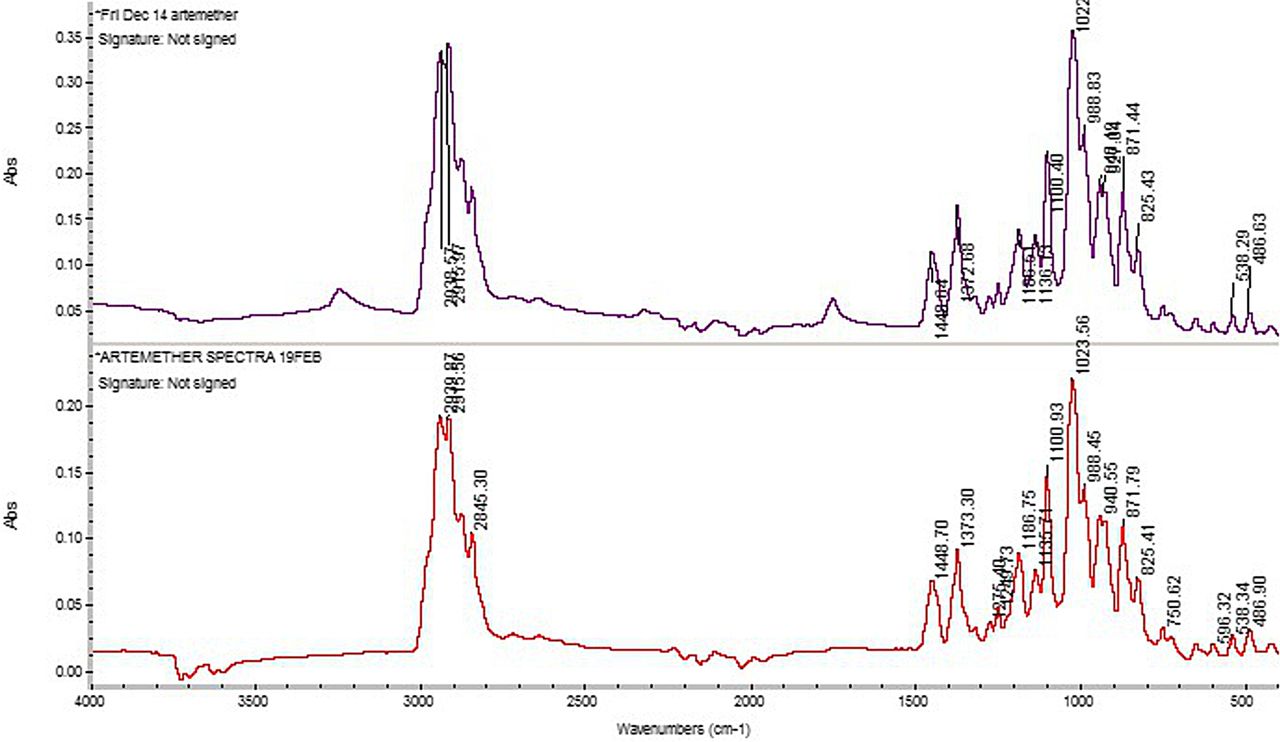
The Fourier transform infrared absorption spectra for artemether (ARTE). Two spectra, taken on Day 0 (upper) and the following Day 66 (lower). These show little change. ARTE is without an OH group or carbonyl bond, so there are no peaks between 3200 and 3600/cm or 1690–1760/cm. It has an additional methyl CH3 group, perhaps corresponding to the peaks at 1373/1372/cm.
Figure 3 consists of two spectra for ART taken 8 weeks apart. The spectra do not have the degree of change seen with the DHA. There is some change in the C–H bond section just under 3000/cm. ART was synthesised to be more water soluble and has a carboxylic acid group, corresponding peaks seen at 1142/1144.53/cm, an additional ether C–O–C bond (smaller peaks between 1080 and 1300/cm), plus an ester bond O=C–O.
ARTE plots show little change with time (figure 4). ARTE is a lipophilic alkylether without an OH group, so there is no peak between 3200 and 3600/cm. There is a large peak that corresponds to C–H bonding between 2850 and 3000/cm. ARTE does not have a carbonyl C=O bond; therefore, there is no peak between 1690 and 1760/cm. It has an additional methyl CH3 group; this may correspond to the peaks at 1373/1372/cm, respectively. The CH3 is attached to an O, so there is a significant amount of C–O–C ether bonds, which can be seen in the peaks between 1080 and 1300/cm.
OMNIC software was used to confirm whether the DHA, ART and ARTE spectra matched spectra of molecules stored within online databases/libraries. Matches were not found, indicating their spectra are unique. A new library was set up containing the spectra for each of the artemisinin derivatives.
Incorporation of DHA into viable erythrocytes and its identification in situ
For the ART and ARTE subtraction spectra, no strong matches were found. For the DHA-treated cells, a match of 80.87% with the spectra was obtained after subtraction for the pure DHA compound (figure 5).
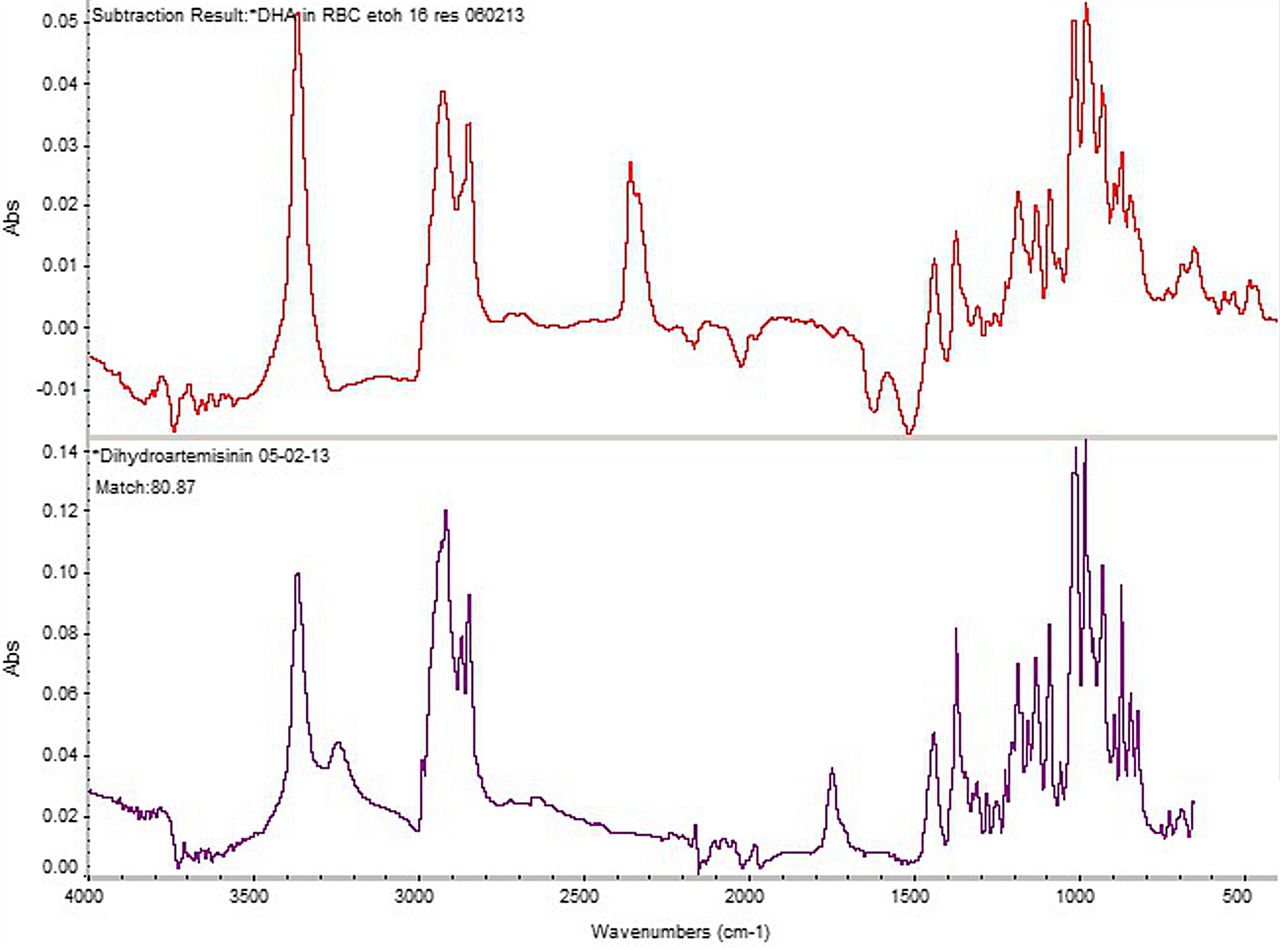
Subtraction and library search spectra for erythrocytes treated with dihydroartemisinin (DHA). Lower plot—spectrum from artesunate ex vivo. Upper plot—subtraction of erythrocyte spectrum from DHA-loaded erythrocytes.
Cytotoxicity to epithelial monolayers
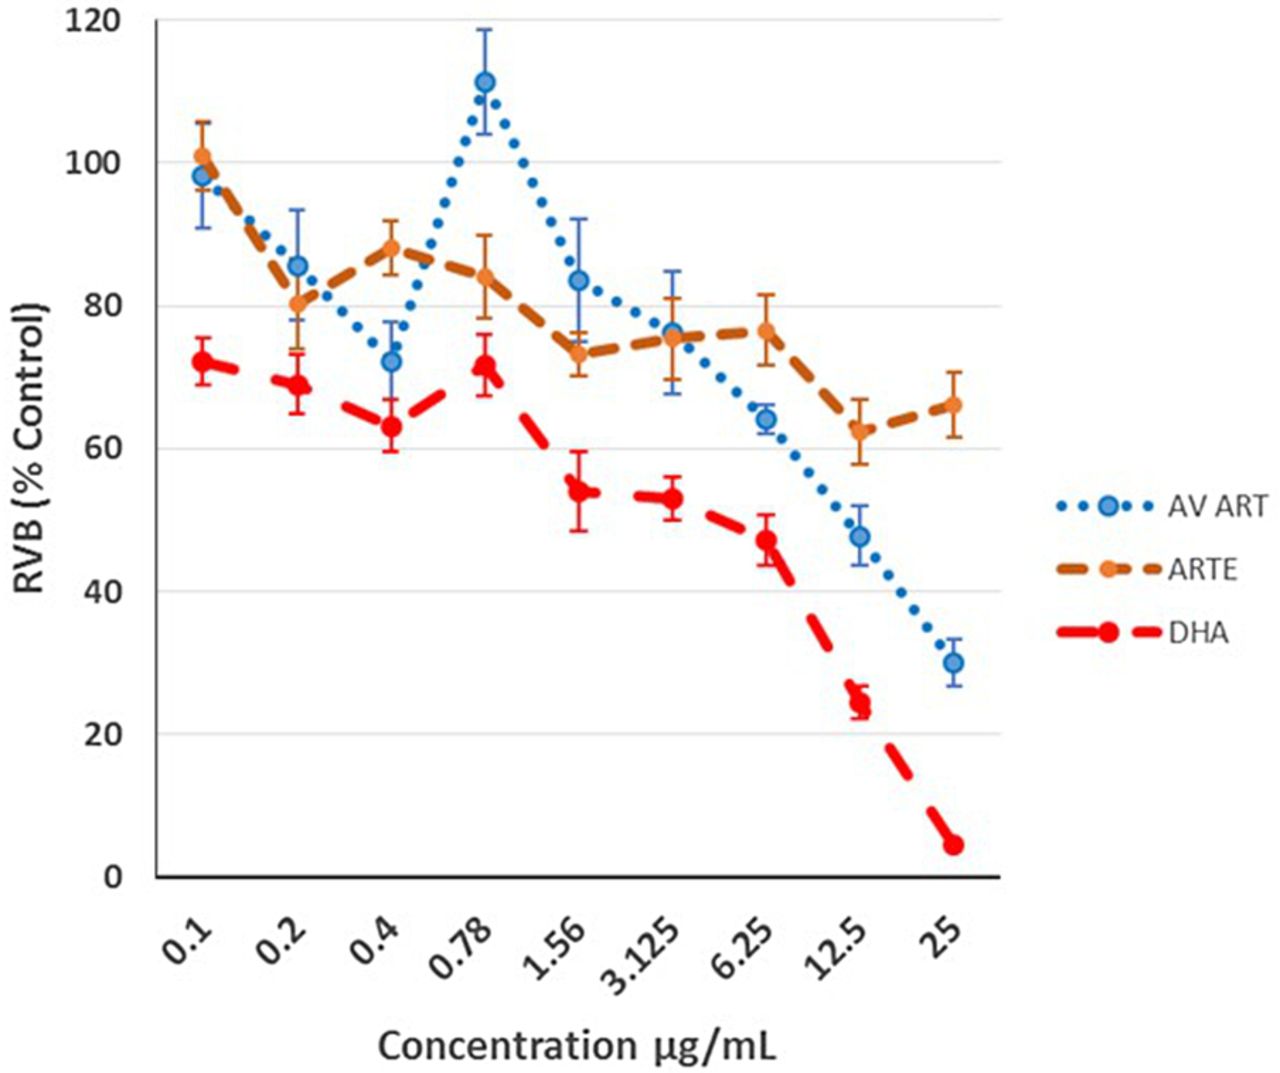
All three artemisinin derivatives showed significant (p<0.05 vs control) toxicity studies using RTT112 bladder cancer cells in an MTT-based assay over 1.5 µg/mL, but the curves for ARTE were flatter than for ART or DHA with respective R2 values of 0.67, 0.74 and 0.96 (figure 6). ARTE failed to achieve a reduction in RVB to 50% of control values inhibitory concentration (IC) 50 up to 25 µg/mL. IC50s for ART and DHA were 3 µg/mL and 9 µg/mL, respectively.
Toxicity of dihydroartemisinin (DHA), artesunate (ART) and artemether (ARTE) to RT112 cells. 3-(4,5-Dimethylthiazol-2-yl)-2,5-diphenyltetrazolium bromide (MTT) assay: residual viable biomass (RVB) as % control (optical density experimental/OD control×100) plotted as means±SEM (n=8) against concentration of drug.
Discussion
Semisynthetic derivatives of the antimalarial drug artemisinin may possess cytotoxic activity against nucleate cells growing in vitro and antiangiogenic activity,4 ,5 offering potential anticancer properties. To further the study of these phenomena, the ability to detect artemisinin uptake and distribution in cells would be advantageous. Live cell imaging studies without the problems of labelling small molecules could be achieved through FT-IR spectroscopy. This study describes mid-range infrared absorption spectra for three artemisinin variants and detects the presence of one, DHA, in erythrocytes incubated with the drugs, although at this stage without imaging. It also assesses the cytotoxic effect of artemisinin derivatives in the RT112 bladder carcinoma cell line.
The structurally unique feature and key source of artemisinin activity is its endoperoxide bridge. However, as there is no net change in the dipole moment during the vibration of homonuclear molecules such as O2, N2 and H2, these molecules do not absorb infrared radiation.19 Therefore, the characteristic O–O bond within the endoperoxide bridge is unlikely to absorb infrared and will not contribute a characteristic peak to the spectra for artemisinins. With that said, the spectra obtained still appeared to be unique and were not found within existing spectral databases. The 1750/cm C=O peak does not fit with the structure of DHA. Wild-type artemisinin does, however, have a C=O bond and this may suggest a level of impurity during the synthesis of DHA.
The erythrocytes experiment indicated artemisinin derivatives spectra were potentially identifiable within a complex environment. The high dose used for this experiment is far in excess of those used elsewhere in the study or are attainable therapeutically, but follow a conventional progression in experimentation, starting with a strong effect that must be achievable for the system to show potential. Concentrations will subsequently be lowered to find threshold detection levels. The subtraction spectra of DHA in erythrocytes achieved an 80.87% match with the spectrum for pure DHA, so some of the compounds entered the cells remaining relatively unaltered. This may be due to a lack of free Fe2+ within the ‘normal’ erythrocytes. It is noteworthy that DHA was the most cytotoxic of the three derivatives towards RTT112 bladder cancer cells in log phase growth. For ART and ARTE, no match was found, indicating that the compounds may not have entered the erythrocytes at all or had been modified beyond recognition by metabolic processes. The former possibility is arguably more likely, as erythrocytes contain limited capacity for active metabolism.
Identifying the spectra of artemisinins within more metabolically active nucleate cells introduces several factors that require consideration and further study. First, as the concentrations of the artemisinin derivatives present are far smaller and much harder to identify within a mixture, a range of different concentrations more closely approximating to clinically achievable plasma values than used here should be applied to cells to assess the concentration limits for detection. Among the highest human plasma concentrations reported in the literature is 443 ng/mL20 compared with the 1 mg/mL applied to the washed erythrocytes in vitro here. Second, a range of cell lines could be used to demonstrate differences in uptake and detection. Third, artemisinins are reactive, with a short half-life in vivo. Oral artemisinins have been credited with a mean absorption time of 0.78 h21 and a residence time of 3.3 h. This compares unfavourably (32%) with bioavailability from intramuscular injection in oil. However, the mean residence time of the latter (10.6 h) was three times longer than following oral administration. Gordi et al22 quotes a half-life of 0.7 h and hepatic extraction ratio of 0.87. When applying the derivatives to cells, key bonds may break (eg, cleavage of the peroxide bridge) changing the molecular structure and altering the absorbance spectrum. Time series during exposure of live cells to drug may yield information on turnover as we have shown using time-lapse fluorescence in other contexts.23 It may also with artemisinins in the first instance be possible to tag the derivatives with a fluorochrome to allow parallel detection through fluorescent microscopy, adding validity to the images from a well-established method. Of course, the handling of a compound may be influenced by the label; circumventing that issue is an important driver towards IR imaging.
Uptake in erythrocytes is a first step towards detection in tissues and ultimately live cells. In this study, it has already thrown up differences in detectability between the three variants used. There are also variations in cytotoxicity against RT112 cells, with ARTE proving markedly less toxic. The focus on bladder cancer reflects the interests of our group, but as noted in the Introduction, the activity against other cancer cells has been demonstrated.4 ,5 Investigating the uptake and processing of artemisinins within cancer cells is therefore worthy of study and would ideally involve applying live cell imaging techniques24 to provide valuable information in real time, particularly if rapid acquisition is possible using limited spectral information—for example, on a Quantum Cascade Laser based instrument.25
Take home messages
This first demonstration that dihydroartemisinin uptake can be detected by its presence in erythrocytes using Fourier transform infrared spectroscopy offers the possibility of localising the drug in fixed or potentially live cells without labelling, using infrared imaging equipment. The failure to detect the other analogues may indicate their speedy intracellular metabolism and might shed light on the differences in cytotoxicity that clearly exist between the analogues, at least to the RT112 cell line in vitro.
References
Supplementary materials
Abstract in Arabic
This web only file has been produced by the BMJ Publishing Group from an electronic file supplied by the author(s) and has not been edited for content.
- Abstract in Arabic - Online abstract
Footnotes
Handling editor Des Richardson
Contributors CH made a substantial contribution to the design, organisation and conduct of the study (including acquisition of study data). AJC made a substantial contribution to the conception, design, organisation and conduct of the study. Also drafted and critiqued the output for important intellectual content. EB made a substantial contribution to the design and execution of the study. BRB made a substantial contribution to the design of the study and helped with critiquing the output for important intellectual content. BAL made a substantial contribution to the conception, design, organisation and conduct of the study. Also critiqued the output for important intellectual content.
Funding The study was funded internally.
Competing interests None declared.
Provenance and peer review Not commissioned; externally peer reviewed.
Data sharing statement The work described here forms part of a continuum in which we are working from microscopic spectral analysis on cells harvested from culture to fixed cells in situ grown on suitable substrates, eventually expecting to arrive at imaging—fixed material and live cells. Preparatory work has been published on a system for imaging live cells under oil (J Clin Pathol. 2013;66:312). This will converge with functional imaging of drugs of interest (mainly putative anticancer agents for uroloncological applications). We have a body of unpublished experience and experimental data/images covering various approaches to these problems, which we are happy to share with interested parties (alan.cooper@port.ac.uk; bashir@soton.ac.uk).