Article Text

Abstract
Aims Different approaches have been described for reporting specimen adequacy for epidermal growth factor receptor (EGFR) mutation analysis. We aimed: (1) to conduct cellularity assessment and to investigate its association with DNA yield, (2) to compare the H&E slides taken before and after the thick sections (curls) obtained for EGFR testing and (3) to evaluate the number of ancillary studies performed.
Methods Cell block (CB) slides of 110 non-small cell lung carcinoma cases submitted to EGFR analysis from 2010 to 2012 were reviewed for total cellularity (ranges 1–100, 100–250, 250–500, 500–750, 750–1000 and >1000 cells), tumour cellularity (ranges 1–50, 50–100, 100–300 and >300 cells) and the percentage of tumour cells. Precurl and postcurl H&E slides were compared using the three criteria. The number of immunohistochemistry (IHC) markers and special stains and DNA yield were recorded.
Results DNA yield was significantly associated with the total cellularity, number and percentage of tumour cells. For 46 cases with precurl and postcurl slides, only three (6.5%) were classified as being different and in two of them the postcurl slide had greater cellularity than the precurl. IHC was performed in 83 cases, with a minimum of 1 and a maximum of 11 markers (median of 3) per case.
Conclusions An association between the total cellularity and the tumour cellularity with the DNA yield was demonstrated using the ranges described. Evaluation of a postcurl slide is an unnecessary practice. The majority of the CB had sufficient material for ancillary studies (up to 11 markers) and mutation testing.
- CELL COUNTING
- CYTOLOGY
- CYTOPATHOLOGY
- EGFR
- LUNG CANCER
Statistics from Altmetric.com
Introduction
Epidermal growth factor receptor (EGFR) gene mutational analysis has become a standard of care for selecting patients with non-small cell lung carcinoma (NSCLC) for treatment with EGFR inhibitors. Techniques with high analytical sensitivity have been recommended for EGFR mutational analysis and according to expert consensus opinion each laboratory should establish the minimum proportion and number of cancer cells needed for mutation detection validation.1
Different approaches have been used for reporting specimen adequacy. The parameter more frequently reported has been the minimum percentage of tumour cells that has ranged from at least 1% to at least 50%.2–13 In one study, samples were assessed according to the percentage of an adequate field, which consisted of a low-power field (10×) with at least 25–50 cells and qualified as poorly cellular (5%–25% of adequate fields), moderately cellular (25%–50% of adequate fields) and highly cellular (>50% of adequate fields).14 The number of tumour clusters of at least 10 cells per low-power field (10×) has also been used for assessment with cell clusters that were >10 cells counted as multiples of 10 clusters as appropriate.2 Categories based on cellularity and percentage of tumour cells have been applied: good cellularity and >25% tumour cells; good cellularity but <25% tumour cells; poor cellularity and >25% tumour cells; poor cellularity and <25% tumour cells and insufficient cellularity (<1000 cells) or necrotic material.5 In a different study, samples were qualified if contained at least 40% tumour cells and categorised as sparse cellularity (<300 tumour cells), low cellularity (300–1000 tumour cells) and normal cellularity (>1000 tumour cells).4 With similar approach, the total number of tumour cells was designated as follows: acellular, no tumour cells (score 0); sparsely cellular, <50 tumour cells (1+); moderately cellular, approximately 50–300 tumour cells (2+) and abundantly cellular, >300 tumour cells (3+).15 In another study, tumour cellularity was defined as the exact number when the cancer cells were <20; as a numerical range when they were >20: 20–49, 50–99, 100–199, 200–499, 500–999 and >1000 cells.3
Limited information is available on the average number of sections that can be taken from a cell block (CB)16 and the number of sections after immunohistochemistry (IHC) for tumour subtyping without exhausting the CB preparation. In order to ensure reliable results and check for the presence of tumour cells in the CB preparation, our laboratory adopted the practice of requesting an additional section for H&E staining to be assessed after the thick sections (curls) for mutational analysis had been taken.
We have previously reported the sample factors associated with success of EGFR mutational analysis in a large series of cytological and histological samples.10 In this study, a subset analysis of cytology cases was performed for reassessment of some preanalytical parameters.
The aims of this study were: (1) to describe an approach for reporting cellularity assessment and to correlate the results with the DNA yield, (2) to document the number of IHC markers and special stains for each case in which mutation testing was performed and (3) to evaluate whether or not the practice of analysing two H&E sections from the CB, one presection to the thick sections (curls) taken for EGFR analysis and one postsection (postcurls) was informative.
Materials and methods
Case selection
An electronic search was performed to select for cytology cases of lung adenocarcinoma or non-small cell carcinoma that had previously undergone EGFR analysis using formalin fixed paraffin embedded (FFPE) CB preparations. Only cases obtained from procedures performed at our own institution with H&E CB slides available for review were included. The University Health Network (UHN) Research Ethics Board approved data analysis protocol.
IHC and histochemical stains
The total number and the IHC markers as well as the number and the type of histochemical stains used were collected from the cytology report for each case. The median for the number of markers was calculated.
DNA extraction, fragment analysis and DNA yield
EGFR mutational analysis was performed using the following assays: fragment analysis for exon-19 deletions and PCR restriction fragment length polymorphism for exon-21 L858R. The EGFR exon-19 deletion assay was based on assessing size differences of fluorescently labelled PCR products. PCR followed by Sau96I restriction enzyme digestion assessed the presence/absence of an exon-21 L858R point mutation. The analytical sensitivity of 1%–5% of the test was established using serial dilutions of cell line DNA.
For each case, two sections of 20 μm thickness (curls) of the FFPE CB were obtained. Deparaffinisation was performed using xylene and alcohol before digesting the tissue with proteinase K (Roche, Laval, Quebec, Canada) with subsequent DNA extraction using the phenol–chloroform method. Details about the protocols, primers and controls used for the assays have been previously reported.10 The DNA yield was retrieved from the molecular laboratory archives.
Cellularity assessment criteria
Each H&E CB slide was examined for the following criteria: total number of nucleated cells, total number of tumour cells and the proportion of tumour cells as a percentage of the total number of nucleated cells. Cell count ranges were established to stratify the total number of nucleated cells and total number of tumour cells. For the total number of nucleated cells, ranges of 1–100, 100–250, 250–500, 500–750, 750–1000 and >1000 were used. Similarly, ranges of 0, 1–50, 50–100, 100–300 and >300 were used to quantify the total number of tumour cells. These ranges were established based on previous studies that included total cell counts and tumour cell counts in their analyses.15 ,17
For cases that had two H&E slides from the same CB (precurls and postcurls) a comparison of the cellularity assessment was performed in order to determine if they were similar or dissimilar based on ranges for the cellularity assessment: total number of nucleated cells and total tumour cell counts.
Cellularity assessment procedure
The three aforementioned criteria were all determined by analysing each CB slide under a light microscope using a 20× objective. The methodology used for cell counts varied depending on the heterogeneity of the CB. For relatively homogenous CBs (ie, CBs with uniformly distributed cells), a quadrant was counted and then used to extrapolate the total number of nucleated cells and/or the total number of tumour cells. For more heterogeneous CBs with distinct clusters of unevenly distributed cells, counting was performed by selecting at least 10 clusters from different areas (at least 10 areas). For CBs that had a noticeably low number of nucleated cells, cell counting was performed upon the entire CB in an S-shaped pattern. Cells that were crushed and too distorted to count were excluded from the total nucleated cell count and total tumour cell count.
Determining the proportion of tumour cells was achieved by scanning the entire CB slide under low-power magnification (10× objective) to select high tumour cell areas and low tumour cell areas. These areas were magnified and the proportion of tumour cells in each area was determined using 20× objective. The proportions across both high and low tumour cell areas were averaged to obtain an approximate overall tumour cell proportion.
Statistical analysis
When more than one specimen was available for analysis, only the first observation was taken. The Kruskal–Wallis test was used to determine if DNA yield was associated with the total number of nucleated cells, the total number of tumour cells and the per cent tumour cellularity.
Results
Patients and sample characteristics
The search yielded 110 cases that were submitted to EGFR mutation analysis from March 2010 to March 2012 after excluding cases with CBs generated at other institutions, cases that slides were not available, cases with inconclusive results and cases with mutation analysis performed on fresh cells or other preparations. The median age of the patients was 69 years, ranging from 36 to 89. There were 58 female and 52 male patients. According to the sampling method and the location, there were 47 lymph node fine needle aspiration (FNA), 43 lung FNA, 14 pleural effusions, 3 bronchial washings, 1 bronchial brushing, 1 bone (vertebra) FNA and 1 pericardial fluid (table 1).
Clinical information and type and location of samples
IHC and histochemical stains
IHC studies were performed in 83 of the 110 cases. In total, 35 different markers were tested for across all 83 cases. These markers included: TTF-1, P16, P53, P63, CK5, CK6, CK7, CK19, CK20, CD45, CD56, CDX-1, CDX-2, S100, WT1, high-molecular weight keratins, low-molecular weight keratins, estrogen receptor (ER), progesterone receptor (PR), vimentin, thyroglobulin, calretinin, synaptophysin, chromogranin, BRST-2, PSA, AE1:AE3, Villin, ALK-1, HEPAR-1, MIB-1, CAM 5.2, HMB-45, CEA and AMACR. In addition to these markers, mucicarmine, PAS/D and bile staining were used in four cases. According to the number of markers, a minimum of 1 marker and a maximum of 10 markers (median of 3) were performed per each case. The maximum total number of markers and histochemical stains performed in a single case was 11.
Cellularity assessment
Of the 110 cases, two had slides from two separated CBs. For the purpose of this study, only the CB used for DNA extraction was considered for the analysis.
Regarding the total number of nucleated cells no cases with <100 cells were identified. For the other categories, the number of cases was distributed as follows: 6 (5.5%) with 100–250 cells, 14 (12.7%) with 250–500, 7 (6.4%) with 500–750, 12 (10.9%) with 750–1000 and 71 (64.5%) with >1000 cells. The number of cases with tumour cellularity of 1–50, 50–100, 100–300 and >300 were 9, 11, 25 and 65, respectively. The overall median for the percentage of tumour cells was 50% (range 5%–90%). The number of cases according to the percentage of tumour cells was as follows: 65 (59.1%) cases with >50% tumour cellularity, 12 with 40%, 11 with 30%, 11 with 20%, 4 with 10% and 7 with <5%.
DNA yield, EGFR mutated samples and correlation with cellularity assessment
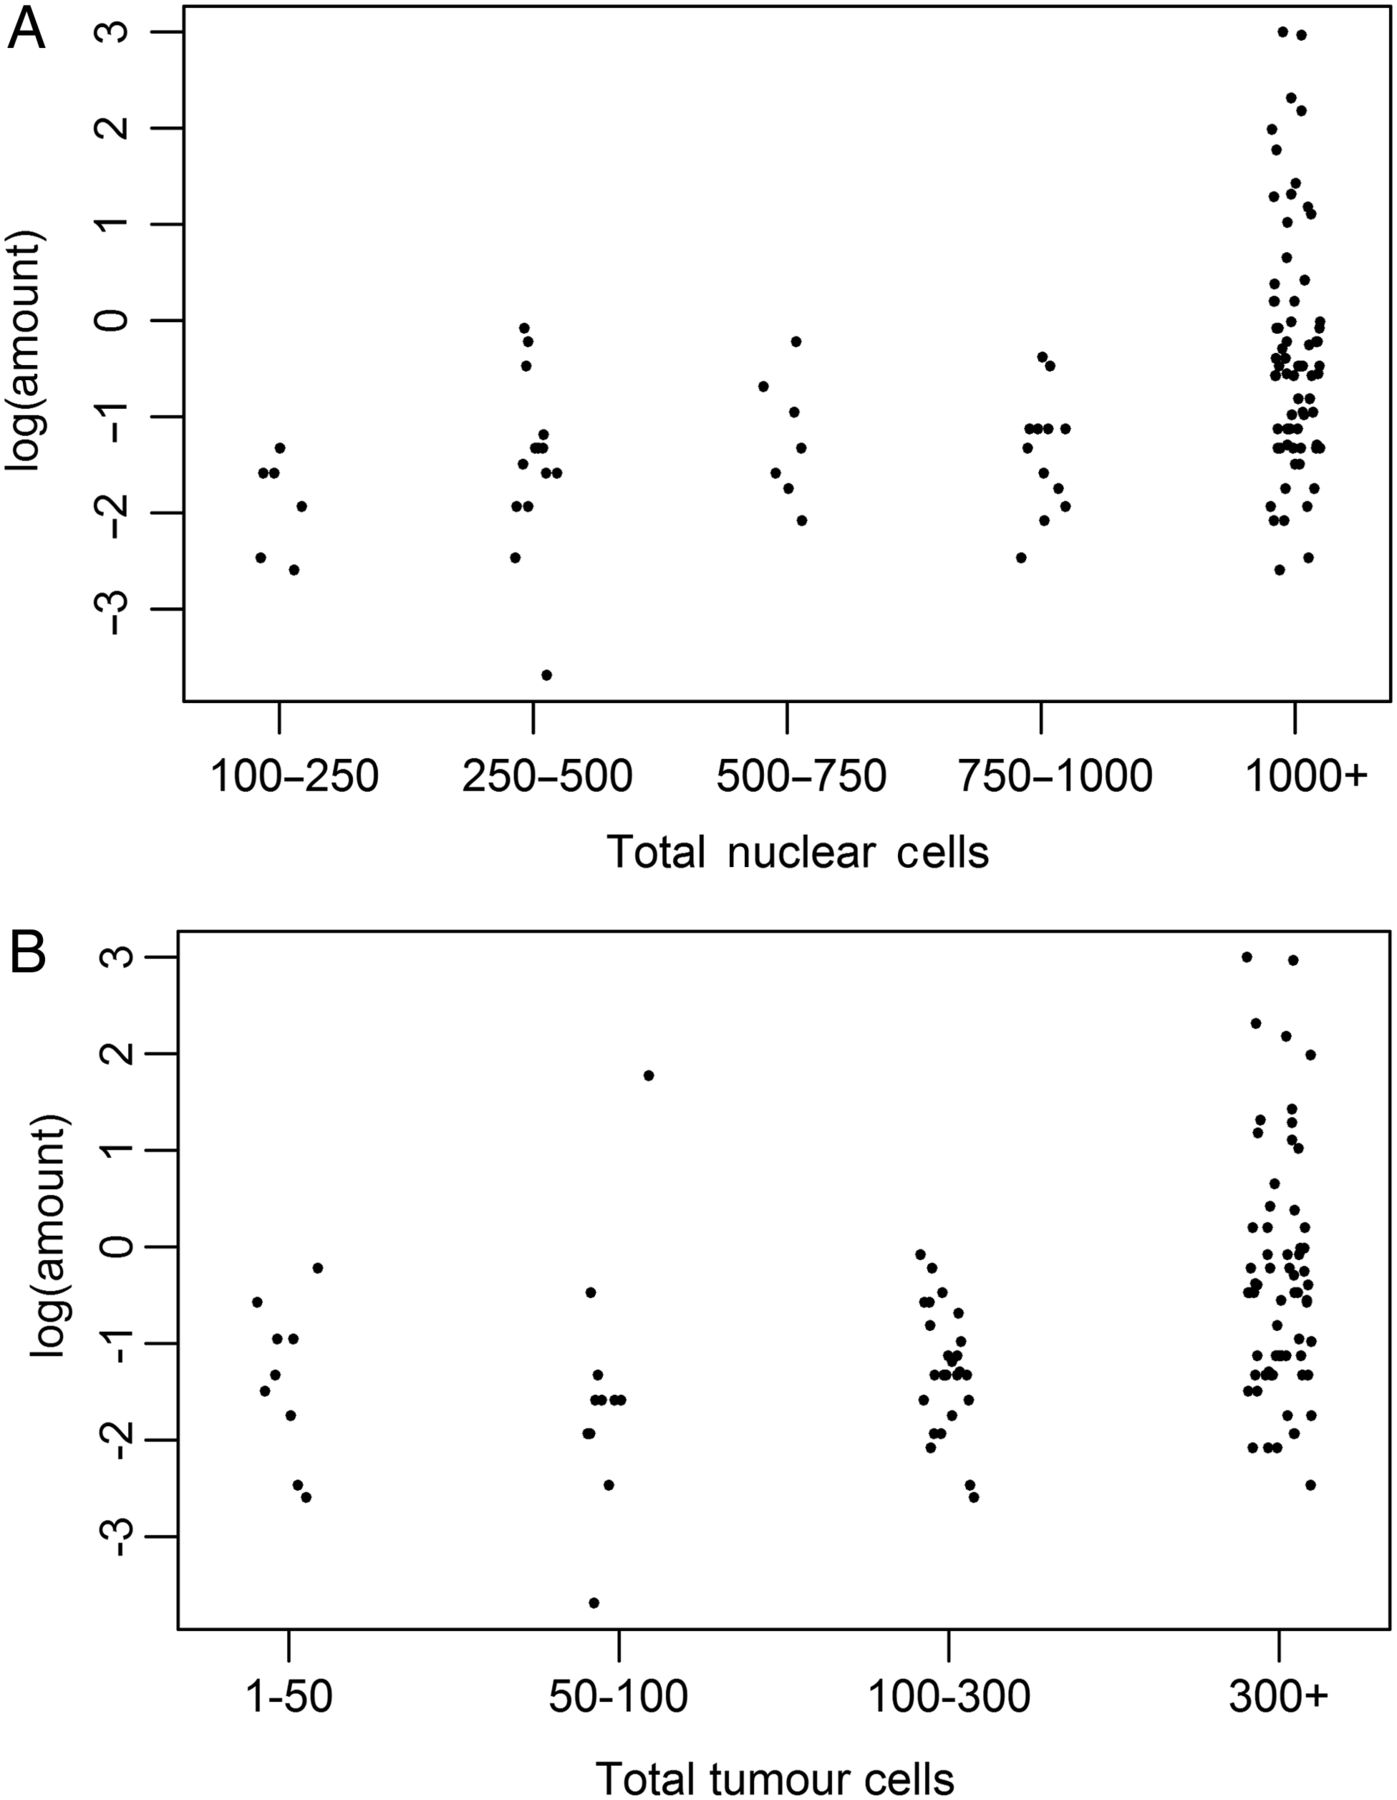
Statistical analysis revealed an association between the total number of nucleated cells as well as the number of tumour cells and percentage of tumour cells with DNA yield (figure 1). Samples with >1000 cells tended to have a higher DNA yield (median DNA yield=0.55 µg) compared with samples with 750–1000 (median DNA yield=0.27 µg), 500–750 (median DNA yield=0.24 µg), 250–500 (median DNA yield=0.22 µg) or 100–250 (median DNA yield=0.15 µg) cells and the DNA yield differed significantly between the five groups (p value<0.001) (table 2). DNA yield was also significantly associated with the number of tumour cells (p value<0.001) (table 3). Samples with >300 tumour cells were observed to have larger median DNA yield (median DNA yield=0.60 µg) than samples containing 100–300 (median DNA yield=0.24 µg), 50–100 (median DNA yield=0.18 µg) and 1–50 (median DNA yield=0.24 µg) tumour cells. Similarly, the median DNA yield for samples with 60%–90% tumour cellularity (median DNA yield=0.65 µg) was larger than samples with tumour cellularity ranges of 40%–50% (median DNA yield=0.24 µg), 20%–30% (median DNA yield=0.24 µg) and <5%–10% (median DNA yield=0.36 µg) and DNA yield differed significantly between the four groups (p value=0.001) (table 4).
Association of total number of nucleated cells and DNA yield (Kruskal–Wallis test)
Association of total number of tumour cells and DNA yield (Kruskal–Wallis test)
Association of percentage of tumour cells and DNA yield (Kruskal–Wallis test)

Dot plots showing the relationship between DNA amount/yield (log-transformed) and total number of nucleated cells (A) and total number of tumour cells (B).
In 36 cases an EGFR mutation was identified: 24 cases with a deletion in exon-19 and 12 cases with a point mutation in exon-21 at codon 858 (L858R). Among those cases 29 (80.5%) had >500 cells and 30 (83.3%) had >100 tumour cells (table 5).
Cellularity and EGFR status
Forty-six cases had at least two H&E stained sections (precurl and postcurl) from the same CB. In 43 of 46 cases, the two sections were considered to be the same (having the same ranges for total cell count and tumour cell count), demonstrating consistency throughout the CB. For the remaining three cases, there was a notable difference in cell counts, either with the total count or the tumour cell content, between the precurl and postcurl sections with two of them having a higher degree of cellularity in the postcurl section. In only one case, the counts were found to be at different ranges with less cellularity in the postcurl section.
Discussion
We have demonstrated that the majority of CBs contained adequate material for both IHC and molecular analyses. Regarding the total number of cells and tumour cellularity, CBs were generally consistent throughout and an association with the DNA yield was found. The practice of taking a postcurl section was uninformative.
We have documented that with up to 11 sections taken for IHC and histochemical stains sufficient material remained for the CB curls for EGFR mutational analysis. An early study showed that up to eight IHC markers could be performed using CB sections.16 In our previous correlation of FNAs and surgical resection specimens of pulmonary nodules, we demonstrated and validated the use of 13 antibodies in CBs, but on average just three markers were used to subtype NSCLC.18 Therefore, a number of cytology cases will not require IHC or just a few markers and material can be saved for molecular studies.
The reliability of mutational analysis is influenced by a number of factors including the number of neoplastic cells in comparison with non-tumorous nucleated cells. A recent review has documented that poor cellularity and low percentage of tumour cells were the most common cause of test failure.19 Similar to previous studies our study showed an association with the cellularity and the amount of extracted DNA.14 ,20 DNA yields were higher in the success group in a study using next generation sequencing (NGS) and success was significantly higher with CB cases than with direct smears.21 Higher tumour cellularity and higher success rates were detected for smears when compared with liquid-based cytology.14 With regards to DNA concentration, in a previous study, 29 (69.0%) of 42 CB specimens would have been classified as inadequate based on a minimum specimen DNA concentration of 25 ng/μL. In 10 out of those 29 cases a mutation was detected, representing about 91% of all cytology specimens with a detectable mutation.2 In a different study, mutation testing failed in 42 cases (5%) with poor cellularity and low percentage of tumour cells (1%–20%) being the most common cause of failure in 24 of the 42 cases (57%). DNA yields in those samples were low (2.3–5.6 ng/mL).5 In an NGS study, the most important variable that affected test success was changing the threshold of the input DNA to below the manufacturer's recommended amount of 10 ng with an increase of the success rate from 58.6% to 89.8%.21
It has been shown that no significant difference in test-success rates has been detected according to the percentage of tumour cells.10 ,20 Even small samples with poor cellularity and low DNA yield (<2 ng/μL) may be successfully tested and mutations can be detected as long as the specimens have representative tumour and have been rigorously fixed and processed to maximise DNA integrity.20 In another study, samples with normal cellularity (<300 tumour cells) had a significantly lower insufficiency rate than samples with sparse cellularity (<300 tumour cells); however, the differences between sparse and low cellularity samples and between low and normal cellularity were not significant.4 Therefore, pathological review for cellularity assessment of all samples submitted to EGFR mutation analysis should be performed. In this study, we propose an approach for systematic assessment of overall cellularity and tumour cellularity in order to facilitate comparison of different studies.
In the current study, 75.4% of the samples had >750 total number of nucleated cells and in 59.1% of the cases the tumour cellularity was >300 cells. The tumour content was >30% in 70% of our cases. Others have demonstrated similar results with 56% of the samples having good cellularity and >30% tumour content with another 11% showing good cellularity but <30% tumour content.20 Another study that included smears and CBs, showed that 178 samples out of 195 had >300 tumour cells.4 In contrast, one study using smears and CBs found a large percentage of acellular CBs (35%), and thus inadequate for molecular testing with direct smears successfully tested in each of those cases.15 Other authors have reported the cellularity just for the mutated cases and unamplified samples with EGFR mutations found in nine samples containing <200 cancer cells and in four samples in which the mean percentage of cancer cells was <50%.3 A study that compared the quality of DNA chromatograms from different exons of the EGFR gene obtained from 30, 50 and 100 cancer cells concluded that the best result was achieved with 100 cells; however, the differences were not statistically significant.22 Due to the high proportion of non-neoplastic cells that may lead false-negative results, specially for small specimens with minimal tumour content, it may be appropriate to add to the report of a negative result a recommendation for repeated testing on an alternate/additional sample.1 ,10
For histological samples (small biopsies and resection specimens), it has been reported that the tumour cell percentage estimates on H&E slides for molecular testing are not accurate, which could result in misinterpretation of test results.23 One strategy suggested to improve the estimation skills of pathologists was that the estimate should be based on the number of nuclei and not on the fraction of surface area of the tumour tissue present in the slide because generally the tumour cells tend to be larger than the inflammatory or stromal cells. In our study, we describe a procedure to perform the assessment and propose categories for reporting the total number of nucleated cells and tumour cells, not only the percentage of the tumour cells.
In summary, we have demonstrated a good correlation between the total cellularity as well as the tumour cellularity with the DNA yield using the categories proposed for cellularity assessment and showed that a postcurl section is an unnecessary practice. We further documented that the majority of the CB had sufficient material for IHC studies (up to 11 markers) and mutation testing. The use of standardised categories for cellularity assessment might allow comparison of future studies and facilitate reporting of the findings.
Take home messages
Cell blocks contain adequate material for both immunohistochemistry (up to 11 markers) and epidermal growth factor receptor mutation analysis.
A good correlation between the total cellularity as well as the tumour cellularity with the DNA yield can be obtained using the following cellularity assessment criteria for H&E cell block sections: (a) for the total number of nucleated cells: ranges of 1–100, 100–250, 250–500, 500–750, 750–1000 and >1000 cells and (b) for the total number of tumour cells: ranges of 0, 1–50, 50–100, 100–300 and >300 cells.
Cellularity assessment of an H&E section taken after the curls taken for mutation analysis (postcurl section) is an unnecessary practice.
References
Footnotes
Handling editor Runjan Chetty
Contributors All authors have been active in the development of the current study and have read and approved the manuscript. The authors understand that should the submitted material be accepted for publication, they will automatically transfer the copyright to the publisher.
Competing interests None declared.
Ethics approval REB at University Health Network #ID 11-0255-TE.
Provenance and peer review Not commissioned; externally peer reviewed.