Article Text

Abstract
OBJECTIVE: To investigate if IgG can be expressed in clear cell renal cell carcinoma (cRCC) , and the expression of IgG is involved in the cancer progression. If IgG expression can serve as a potential target in cancer therapies and be used for judging the prognosis.
MATERIALS AND METHODS: By immunohistochemistry, we detected IgG in cRCC tissues(75 cRCC tissues and75 adjacent normal kidney tissues). Immunofluorescence and Western blot was used to detect the IgG in cRCC cell lines (786-0, ACHN and CAKI-I). By RT-PCR, the functional transcript of IgG heavy chain was detected. Knockdown of IgG was to analyze the proliferation, migration and invasion ability by CCK8, Transwell and Matrigel and apoptosis in cRCC cell lines.
RESULTS: By immunohistochemistry, we found strong staining of IgG in 66 cases of 75 cRCC tissues and 63 cases of 75 adjacent normal kidney tissues. Immunofluorescence and Western blot was found IgG in cRCC cell lines. Knock-down IgG in cRCC cell lines resulted in significant inhibition of cell proliferation, migration and invasion, and the induction of apoptosis of the 786-0 cells. The immunohistochemistry analysis showed that high IgG expression significantly correlated with the poor differentiation and advanced stage of cRCC.
CONCLUSION: IgG was over expressed in cRCC and was involved in the proliferation, migration and invasion of cancer cells. IgG expression may serve as a potential target in cancer therapies and could be used for judging the prognosis.
- RENAL CANCER
- TUMOUR MARKERS
- TUMOUR BIOLOGY
This is an Open Access article distributed in accordance with the Creative Commons Attribution Non Commercial (CC BY-NC 4.0) license, which permits others to distribute, remix, adapt, build upon this work non-commercially, and license their derivative works on different terms, provided the original work is properly cited and the use is non-commercial. See: http://creativecommons.org/licenses/by-nc/4.0/
Statistics from Altmetric.com
Introduction
Renal cell carcinoma (RCC) is the most common type of kidney cancer in adults. The incidence of RCC has been rapidly increasing for the last 20 years, and is increasingly being discovered at earlier stages.1 It was estimated that there were 1 660 290 new cases of RCC in the USA in 2013 with almost 580 350 deaths.2 In 2010, the American Joint Committee on Cancer suggested a new clinical stage system in which RCC is divided into four stages. Clear cell carcinoma has the two most frequent subtypes: clear cell renal cell carcinoma (cRCC, 80%) and clear cell papillary cell carcinoma (pRCC, 10%–15%). Because there are limited early warning signs, most patients are at an advanced state when they are diagnosed, and the cancer's resistance to chemotherapy or radiotherapy makes treating these patients rather difficult. Therefore, it is essential to find a new method to predict the prognosis of cRCC. Investigating the mechanisms underlying the carcinogenesis of cRCC may provide more sophisticated early diagnostic and further therapeutic strategies.
Immunoglobulin (Ig) is the most classical immune molecule family. Since 500 million years ago, Ig has become more complex. This development has resulted in the formation of complicated structures of different types, and infinite varieties can be found in the variable region. However, Ig strictly acts as an antibody and is only secreted from B lineage cells. In recent years, various pieces of evidence have revealed that Igs including IgM, IgG and IgA, can be expressed in many non-B cell lineages, such as epithelial cells, germ cells and neurons.3–7 Importantly, non-B-cell-derived Ig’s, especially the IgG, have frequently been found to be overexpressed in many cancer cell types, including breast cancer, colon cancer, lung cancer, liver cancer, stomach cancer, cervical cancer, pancreatic cancer, ovarian cancer and prostate cancer.3 ,8–13 Furthermore, unlike classical IgG, which has an antibody function, cancer cell-derived IgG is mainly involved in the survival and progression of cancer cells.
In our previous studies, commercial antibodies against IgG could mainly recognise the circulating IgG, but they were not specific for the non-B-cell-derived IgG. RP215 was originally generated by Lee et al14 using the cell lysate of ovarian cancer cell line OC-3-VGH as an immunogen. We identified that antibody RP215 specifically recognises a glycosylated epitope of non-B cell expressed IgG heavy chain (RP215-recognised IgG).15–17 In this study, we found that the IgG recognised by RP215 was expressed in renal carcinoma cells. Knockdown of IgG in renal carcinoma cell lines resulted in significant inhibition of cancer cell proliferation, migration and invasion. Importantly, using RP215, we found that high IgG expression was significantly correlated with poor differentiation and advanced stage.
Materials and methods
Tissue microarray
The tissue microarray, including 75 different cases of cRCC and adjacent normal kidney tissues, were purchased from Shanghai Outdo Biotech (Shanghai, China). The Fuhrman grade (WHO 1997) guided the grade of this study. Fuhrman grade is the most widely accepted histological grading system in RCC. The methods: I, small, round, uniform nuclei with inconspicuous or absent nucleoli; II, larger nuclei with irregular outline and small nucleoli; III, larger nuclei with irregular outline and prominent nucleoli; IV, grade III features with bizarre, multinucleated cells, with or without spindle cells.
The tissue of breast cancers and lymph nodes were obtained from patients in at Peking University People's Hospital.
Ethics statement
This study was approved by the ethics committee of Peking University People's Hospital. All patients provided written informed consent.
Cell culture
Three renal carcinoma cell lines (CAKI-I, 786-0 and ACHN) were obtained from American Type Culture Collection. Cells were cultured in RPMI 1640 (Hyclone, Logan, Utah, USA) medium supplemented with 10% fetal bovine serum (Hyclone) and incubated at 37°C in a humidified atmosphere containing 5% CO2.
Immunohistochemistry analysis
RP215 is provided by Gregory Lee of University of British Columbia in Vancouver, Canada. The sections containing clinical samples were dewaxed, rehydrated and then heated in 10 mmol/L citrate buffer (pH 6.0) for antigen retrieval. After, the sections were washed in phosphate-buffered saline (PBS), blocked with 10% normal goat serum for 30 min and incubated with 15 µg/mL purified RP215 in a humidified chamber at 4°C overnight. Inmunodetection was performed using the Envision ABC Kit (Gene Tech Company, Shanghai, China). After staining with haematoxylin, the tissues were dehydrated and mounted. A pathologist evaluated the extent and intensity of RP215 staining independently and without clinical data. We used the breast cancer tissues as a positive control.
Both the relative number of positive cells and intensity of staining were assessed in five randomly chosen 200× microscopic fields. The percentage of stained cells per field was defined as the following: 0, negative; 1, 1%–25%; 2, 26%–50% and 3, 51%–100% of the cells. The staining intensity was scored on a four-tiered scale as follows: 0, absence of signal; 1, low-intensity signal (light brown); 2, moderate-intensity signal (brown) and 3, high-intensity signal (dark brown). The frequency score and intensity score were multiplied to obtain the score for each field, and the final score for each case was the average score of the five fields. The score for RP215 staining was described as negative (−) when the score was 0–1. ‘Low expression’ encompassed scores of 2–3 (+) while ‘high expression’ encompassed scores of 4–6 and 7–9 (++ and +++, respectively). All evaluations were conducted using a LEICA DM4000B/M microscope.
Immunofluorescence
ACHN, 786-0 and CAKI-I cell lines that reached 60%–70% confluence prior to the test were seeded into the 12-well plates in 37°C incubators with 5% CO2. The cells were fixed with acetone for 5 min at room temperature. Then, the cells were blocked with 10% normal goat serum for 30 min and incubated with 25 µg/mL purified RP215 as a primary antibody at 4°C for 45 min; the cells were then incubated with the secondary antibody (1:400, polyclonal goat antimouse IgG-H&L; Abcam, Cambridge, UK) at 4°C for 30 min. Images were captured using the inverted fluorescence microscope subsequent to being mounted using 50% glycerine.
Western blot
Protein was extracted using lysis buffer (RIPA, 1% Triton X-100, 0.1% sodium dodecyl sulfate, 1% sodium deoxycholate, 0.15 M NaCl and 10 mM Tris, pH 7.2). The protein concentration was assessed using Pierce BCA Protein Assay Kit (Thermo, Rockford, Illinois, USA). Protein samples (50 µg) were separated by electrophoresis in 12.5% sodium dodecyl sulfate–polyacrylamide gels and were then transferred onto a nitrocellulose membrane (Millipore, Bedford, Massachusetts, USA). The membrane was blocked in 5% non-fat milk for 1 h and incubated with primary antibodies (7.5 μg/mL) at 4°C over night. The blots were incubated with antimouse IgG horseradish peroxidase conjugate at room temperature for 1 h. Immunoreactive bands were visualised using Super Signal West Pico Chemiluminescent Substrate (Thermo).
siRNA and cell transfection
The siRNAs against Ig gamma chain constant region (siRNA1, 5′-GGUGGACAAGACAGUUGAG-3′ and siRNA2, 5′-AGUGCAAGGUCUCCAACAA-3′) and the non-silencing control RNA (NC, 5′-UUCUCCGAACGUGUCACGU-3′) were produced and purchased from GenePharma (Shanghai, China). The siRNAs and NC were transferred into the 786-0 and ACHN cell line by Lipofectamine 2000 transfection reagent (Life Technologies, Grand Island, New York, USA) according to the manufacturer's instructions. The knockdown efficiency of IgG was verified by western blot analysis.
Reverse transcriptase-polymerase chain reaction
Total RNA of cRCC cell lines, CAKI-I, 786-0 and ACHN was extracted by TRIzol reagent and then reverse transcribed using RT-PCR RevertAid, First-Strand cDNA Synthesis Kit (Thermo) according to the manufacturer's instruction. The primers were IgG (forward, 5′-ACTACAAGACCACGCCTCC-3′; reverse, 5′-CGTCGCACTCATTTACCC-3′) and GAPDH (forward, 5′-CAAGGTCATCCATGACAACTTTG-3′; reverse, 5′-GTCCACCACCCTGTTGCTGTAG-3′).
PCR products were electrophoresed on 1.5% agarose gels containing 0.5 μg/mL ethidium bromide.
Cell proliferation assay
The 786-0 and ACHN cells were transfected with siRNA (50 µg/mL) in 96-well plates and incubated at 37°C. Cell proliferation was analysed using the CCK8 Cell Proliferation Assay Kit (Invitrogen, Carlsbad, California, USA). CCK8 reagent (5 µL) was added to each well and incubated for 2 h. The number of viable cells was calculated by absorbance measurements at 450 nm. Each condition was assessed in triplicate.
Cell apoptosis assay
786-0 and ACHN cells were cultured for 20 h and then treated with siRNA for 48 h. The cells were then harvested, washed with ice-cold PBS and stained with annexin V/PI (AV/PI) reagent as previously described. The percentage of annexin V cells was determined by flow cytometry. The percentage of annexin V cells indicates the frequency of total apoptotic cells.
Cell migration assay
The migration assay was performed in a 24-well transwell (Corning, Corning, New York, USA) containing a polycarbonate filter (8 μm pore size). The 786-0 and ACHN cells were counted as 105 of each group to add in the transwell chamber. Conditioned medium containing 10% fetal bovine serum was added to the bottom part of the chamber. The cells were incubated in a 5% carbon dioxide incubator at 37°C for 24 h. After incubation, cells in the upper chamber that were attached but had not migrated were scraped off, and the migrated cells on the bottom of the filter were fixed with methanol and stained with haematoxylin. The number of cells was counted in at least six randomised fields under a microscope. Results were obtained from at least three individual experiments.
Cell invasion assay
The invasion assay was performed in a 24-well invasion (Corning) containing a polycarbonate filter (8 μm pore size). The 786-0 and ACHN cells were counted as 105 of each group to add in the invasion chamber. Conditioned medium containing 10% fetal bovine serum was added to the bottom part of the chamber. The cells were incubated in a 5% carbon dioxide incubator at 37°C for 24 h. After incubation, cells in the upper chamber that were attached but had not migrated were scraped off, and the migrated cells on the bottom of the filter were fixed with methanol and stained with haematoxylin. The number of cells was counted in at least six randomised fields under a microscope. Results were obtained from at least three individual experiments.
Statistical analyses
Data were presented as values of mean±SEM. Statistical analysis was carried out with χ2 test and Cox analysis. The values of p<0.05 were considered statistically significant. All statistical evaluations were performed with SPSS V.17.0 (SPSS, Chicago, Illinois, USA).
Results
IgG was expressed in the cRCC cells
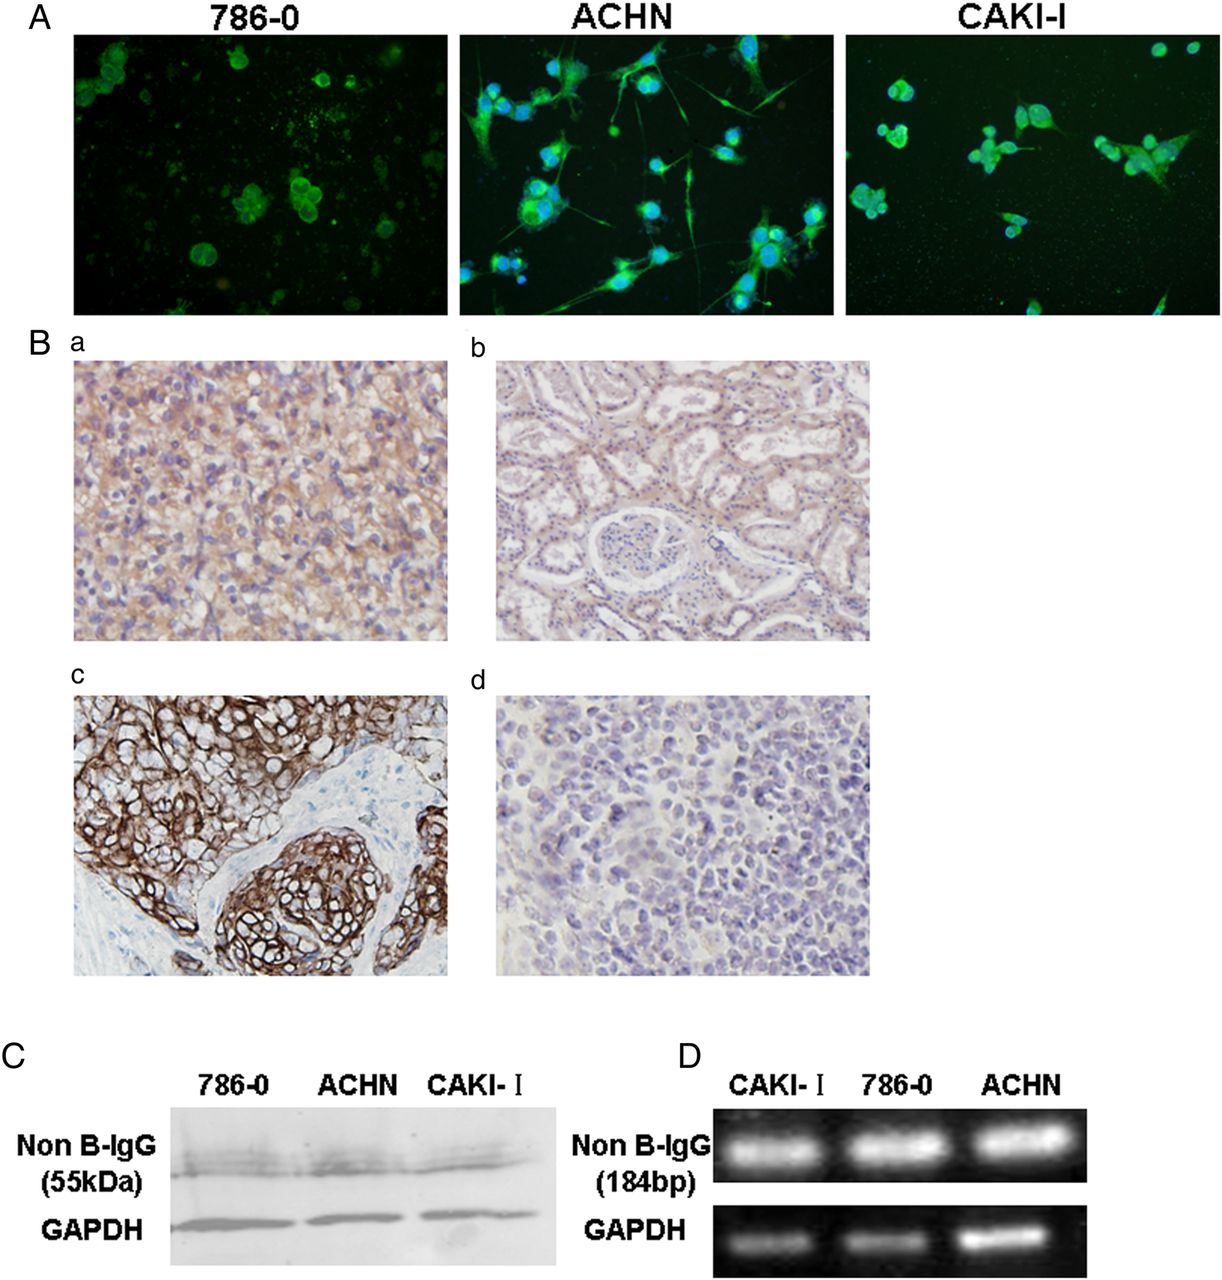
In this study, the IgG staining was detected in cRCC cell lines (CAKI-I, 786-0 and ACHN) by IF. We found IgG staining in the cell cytoplasm, filopodia structure and extracellular area (figure 1A). Immunohistochemistry also showed that positive staining of IgG was frequently located in the cytoplasm of cancer cells in cRCC tissues (66/75, 88%) and in the adjacent normal kidney tissues (63/75, 84%). The breast cancer tissues were used as the positive control (figure 1B:c). Importantly, IgG and its functional transcripts were also confirmed in cRCC cell lines by western blot and RT-PCR (figure 1C, D).

IgG was expressed in the clear cell renal cell carcinoma cells. (A) The IgG expression in clear cell renal cell carcinoma 786-0 cells, ACHN cells and CAKI-I cells was analysed by immunofluorescence using the RP215. (B. a, b) IgG expression in cancer cells of clear cell renal cell carcinoma tissues and some normal tubular epithelial cells in adjacent normal kidney tissues by immunohistochemistry staining; (c) the breast cancer tissue was used as the positive control; (d) no positive staining showed in lymph node. (C) IgG expression was detected in the 786-0, ACHN and CAKI-I cell lines by western blot. (D) IgG gene transcription was detected in the 786-0, ACHN and CAKI-I cell lines by RT-PCR.
Knockdown of IgG significantly reduced the proliferation of both 786-0 cells and ACHN cells
To investigate whether IgG is responsible for cell proliferation in cRCC cells, we designed two siRNAs to knockdown IgG expression in cRCC cell lines (786-0 and ACHN) and analysed the cell proliferation ability. Our results showed that the cell proliferation ability was significantly downregulated after the knockdown of IgG heavy chain expression in 786-0 and ACHN cells (figure 2).

IgG knockdown significantly reduced the proliferation of renal carcinoma cells. (A) IgG was detected in the clear cell renal cells by western blot after knockdown of IgG expression by siRNAs. (B) The proliferation of 786-0 and ACHN cells was inhibited after knockdown of IgG expression in 786-0 cells and ACHN cells for 48 h by CCK8.
Knockdown of IgG significantly reduced apoptosis in 786-0 cells, but not in ACHN cells
We also wondered whether IgG is also involved in apoptosis in cRCC cell lines. Cultured 786-0 and ACHN cell lines were stained by AV/PI after knockdown of IgG. We found that knockdown of IgG could significantly induce apoptosis of 786-0 cells, which was not the case for ACHN cells (figure 3). These results suggested that IgG knockdown reduced the survival of 786-0 but not ACHN cells.

The apoptosis of clear cell renal cell carcinoma cells was induced by specific siRNA for IgG. IgG knockdown could significantly induce the apoptosis of 786-0 cells, but not in the ACHN cells by FACS using the siRNA-1-specific and siRNA-2-specific siRNA for IgG.
Knockdown of IgG significantly reduced the migration of both 786-0 and ACHN cells
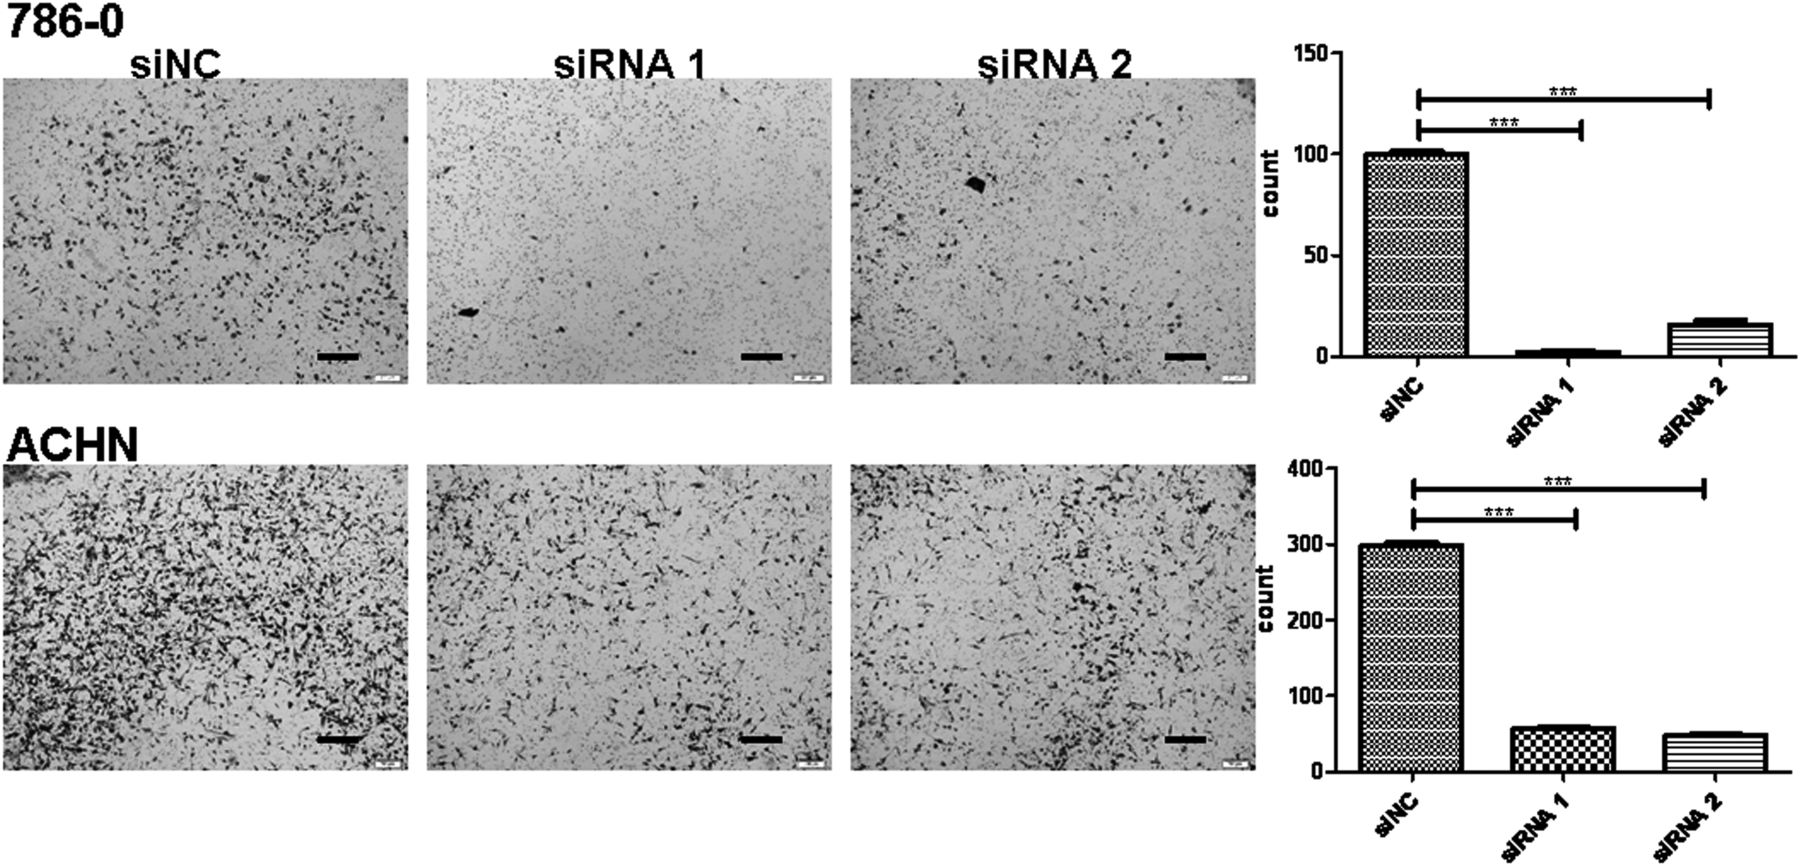
After we found that knockdown of IgG could induce the migration of the 786-0 cells and ACHN cells, we aimed to determine whether IgG is involved in the migration of cRCC cells by performing transwell assays with the same number of 786-0 and ACHN cells in each group. The ability of migration was significantly inhibited after knocking down IgG heavy chain in 786-0 and ACHN cells (figure 4).

IgG knockdown significantly detected the migration of renal carcinoma cells. Migration ability of 786-0 cells and ACHN cells was determined after the IgG expression was knockdown for 24 h by Transwell assay. Data represent the mean±SEM of cells of at least three random fields under microscope, and the experiment was repeated three times (*p<0.05).
The invasion ability of both 786-0 and ACHN cells was also reduced by siRNA
We also examined whether IgG is also involved in the invasion of cRCC cells. We performed invasion assays in 24-well invasion chambers using the same number of 786-0 and ACHN cells in each group. We also found that after IgG expression was knocked down in both 786-0 and ACHN cells, the number of invading cells was significantly decreased (figure 5).

The invasion ability of renal carcinoma cells was also detected by specific siRNA for IgG. Invasion ability of 786-0 cells and ACHN cells was determined after the IgG expression was knockdown for 48 h by Matrigel assay. Data represent the mean±SEM of cells of at least three random fields under microscope, and the experiment was repeated three times (*p<0.05).
IgG expression is significantly correlated with poor differentiation and an advanced stage of cRCC
We analysed whether IgG expression is correlated with the poor differentiation, tumour size and advanced stage of cRCC using immunohistochemistry. There was a higher positive rate of IgG staining in patients with histological grades III–IV (34/35, 97.1%) than in patients with histological grades I–II (80.0%, 32/40), and there was a significant difference between the patients with high and low grades (p<0.05) (figure 6A). Comparing the positive frequency between a larger tumour size (>7 cm) and smaller tumour size (≤7 cm), we found that the positive rate of patients with a large tumour was 94% (31/33), which had a higher frequency than patients with smaller tumours (35/42, 83.3%; p<0.05) (figure 6B). More importantly, IgG expression was significantly related to the recurrence of cRCC. A strong positive rate (≥++ and +++) was observed in 87.0% (20/23) of patients with stages III–IV of cRCC, while a strong positive rate was observed in only 48% (25/52) of patients with stages I–II (p<0.05) (figure 6C and table 1). Gender may also be related to IgG expression (p<0.05), but there is no relationship between the IgG expression and age. The median survival time for IgG strong positive staining group was 40.1176 months; while the median survival time for IgG weak positive staining group was 49.0220 months.
Clinicopathological variables and evaluation of non-B-IgG immunostaining in clear cell renal cell carcinoma tissues

IgG expression significantly correlated with the poorly differentiated and advanced stage of cRCC. (A. a–c) The frequency of IgG-positive staining was compared between the patients with high and low grades, larger and smaller tumour sizes, I–II and III–IV stages by immunohistochemistry. (B) The correlation of non-B-IgG expression and 7-year overall survival of patients with clear cell renal cell carcinoma. The survival of the IgG staining that was weakly positive (negative and ‘+’) was significantly longer than that of IgG strongly positive (‘++’ and ‘+++’) patients. (C. a) Strong RP215 staining in high grade of CRCC; (b) weak RP215 staining in low grade of cRCC.
Correlation between non-B-IgG expression and survival in patients with cRCC
The correlation of non-B-IgG expression and 7-year overall survival of patients with cRCC was elevated according to the results of Kaplan–Meier analysis. The survival of patients with weak positive (negative and ‘+’) IgG staining was significantly longer than that of patients with strong positive (‘++’ and ‘+++’) IgG staining (p<0.05; figure 6). Cox multivariable analysis also showed that IgG strong positive staining (HR=3.494, p=0.0455) and histological grade ((HR=2.632, p=0.0089) were risk factors of poor prognosis for patients with cRCC (table 2).
Cox's proportional hazards model analysis of prognostic factors in patients with cRCC
Discussion
In this study, we found that IgG was significantly expressed in the cRCC cells and tissues, and IgG expression was found to be involved in the proliferation, migration and invasion of cRCC. Importantly, IgG expression was related to the poor differentiation, large tumour size and advanced clinical stage.
IgG has thus far been considered to be only produced in B cells and to only have an antibody function. Since Qiu et al3 (1996)18 first reported that the IgG was expressed in non-B-cell-derived cancer cells based on evidence supporting that the Ig’s are not only expressed in B cells, they are also expressed in non-B cells.3 ,4 ,7 ,19 Additionally, they are especially overexpressed in the cancer cells, including in many epithelial cancer cells and the mesenchymal tissue origin of cancer cells.9 ,10 In this study, we further confirmed that IgG was significantly expressed in the primary cRCC cells and its derived cancer cell lines at the protein and mRNA levels by immunohistochemistry, western blot and RT-PCR. In addition, the adjacent normal kidney tissues, especially the renal tubular epithelial cells, could express the IgG. However, the function of IgG produced by normal kidney cells requires further investigation.
Moreover, it was reported that the IgG expressed in cancer cells has growth-factor-like activity, which can promote the proliferation and survival of cancer cells, and is involved in the carcinogenesis of breast cancer.20 In this study, we also found that cRCC cell-derived IgG can promote cell proliferation. Knock down of IgG induced the apoptosis in 786-0 cells, but not in the ACHN cells. We then determined whether IgG could affect the migration and invasion ability of cRCC cells with the same numbers in each group of 786-0 and ACHN cells by the Transwell and Matrigel assays. The results showed that renal carcinoma cell-derived IgG showed a significant promoting effect on cell migration and invasion in both 786-0 and ACHN cells. According to the apoptosis results, we concluded that IgG may be involved in the metastasis and prognosis of renal carcinoma cells while suppressing the interference of apoptosis. In addition, tumour metastasis is the leading cause of cancer mortality worldwide. The migration and invasion ability of cancer cells is a prerequisite for metastasis.
Additionally, the poorly differentiated cRCCs have a poor prognosis. However, to date, no independent prognosis factor has been found to be useful for predicting the prognosis of cRCC. In this study, we further analysed the relationship between IgG expression and the histological grade of cRCC. We unexpectedly found that IgG expression was significantly related to poor differentiation of cRCC.
Moreover, in our previous study, we found that IgG expression is strongly correlated with poor differentiation, local invasion, metastasis and poor prognosis in patients with lung adenocarcinoma, which suggested that IgG might serve as a new prognostic biomarker for lung adenocarcinom.21 In the future, we will investigate the role of IgG in the prognosis of patients with cRCC. Furthermore, the clinical stage and tumour size are indicators for survival in cRCC. We also found that IgG was related to the clinical stage and tumour size of cRCC, suggesting that the IgG can be used to predict the prognosis of cRCC as a novel independent prognostic factor. Through the survival analysis, we found that the IgG expression was related to the patient survival period, which further confirmed that IgG could affect the patient prognosis. Cox multivariable analysis showed that IgG expression is a risk factor of poor prognosis for patients with cRCC.
In view of the expression of the IgG being correlated with the poor differentiation and poor prognosis of cRCCs, moreover, knockdown of IgG significantly inhibited the proliferation, migration and invasion of cRCC cell lines, which suggested that IgG recognised by RP215 may serve as a potential therapeutic target for cRCCs.
Overall, we found that IgG was overexpressed in cRCC and was involved in the proliferation, migration and invasion of cancer cells. IgG expression may serve as a potential target in cancer therapies and could be used for judging the prognosis.
Take home messages
IgG was expressed in the clear cell renal cell carcinoma (cRCC) tissues and cell lines.
IgG could affect the biological behaviour of cRCC cells, such as proliferation, migration, invasion and survival.
IgG expression had clinical significances in patients with cRCC: high expression of IgG was related to the poor differentiation and advanced stage of cRCC. IgG might serve as a novel target for cRCC therapy.
Acknowledgments
We thank Peking University Center for Human Disease Genomics for their generous offer of RP215 antibody. We also thank the Peking University People's Hospital Department of Pathology for their technology support of immunohistochemistry and staining evaluation.
References
Supplementary materials
Abstract in Chinese
This web only file has been produced by the BMJ Publishing Group from an electronic file supplied by the author(s) and has not been edited for content.
- Abstract in Chinese - Online abstract
Footnotes
ZS and YL contributed equally.
Handling editor Cheok Soon Lee
Contributors TX and XQ performed all technical procedures and contributed to experimental design. ZS and YL contributed to the experimental conduct. CQ and ZL collected the data. YY and FH contributed to data analysis. YD and HY contributed to article preparation.
Funding This work was supported by grants from the National Nature Science Foundation of China (Nos 81272237,91229102 and 81472393) and supported by Beijing Natural Science Foundation (No 7152149).
Competing interests None declared.
Provenance and peer review Not commissioned; externally peer reviewed.