Article Text

Abstract
Objectives: To investigate whether anti-Saccharomyces cerevisiae antibodies (ASCA), a marker for Crohn’s disease (CD), are present in spondyloarthropathies (SpA) and in the subgroups ankylosing spondylitis (AS), undifferentiated SpA (uSpA), and psoriatic arthritis (PsA), in comparison with healthy and inflammatory controls (patients with rheumatoid arthritis (RA)).
Methods: ASCA IgA and IgG levels were measured with an enzyme linked immunosorbent assay (ELISA) kit (Medipan, Germany) in 26 patients with CD, 108 patients with SpA (43 patients with AS, 20 patients with uSpA, 45 patients with PsA), 56 patients with RA and 45 healthy controls. Gut biopsy samples were available in 18 AS and 10 patients with uSpA, these samples were screened for the presence of inflammation.
Results: Both ASCA IgG and IgA levels were raised in CD compared with healthy controls and patients with RA. ASCA IgA, but not IgG levels, were higher in SpA than in both healthy and RA controls. ASCA IgA levels were raised in AS and uSpA, but not in PsA. No significant differences in ASCA IgA levels were noted between patients with SpA with and without histological gut inflammation.
Conclusion: ASCA IgA levels are significantly higher in SpA, and more specifically in AS, than in healthy controls and patients with RA. This is the first serum marker associated with SpA. No correlation between the presence of subclinical bowel inflammation and ASCA IgA levels was noted. However, it remains to be evaluated whether patients with SpA with ASCA have an increased risk of developing CD.
- anti-Saccharomyces cerevisiae antibodies
- spondyloarthropathy
- serology
- AS, ankylosing spondylitis
- ASCA, anti-Saccharomyces cerevisiae antibodies
- CD, Crohn’s disease
- CRP, C reactive protein
- ESR, erythrocyte sedimentation rate
- ESSG, European Spondylarthropathy Study Group
- IBD, inflammatory bowel disease
- OD, optical density
- PsA, psoriatic arthritis
- RA, rheumatoid arthritis
- ROC, receiver operating characteristics
- SpA, spondyloarthropathies
- TNFα, tumour necrosis factor α
- uSpA, undifferentiated spondyloarthropathy
Statistics from Altmetric.com
- AS, ankylosing spondylitis
- ASCA, anti-Saccharomyces cerevisiae antibodies
- CD, Crohn’s disease
- CRP, C reactive protein
- ESR, erythrocyte sedimentation rate
- ESSG, European Spondylarthropathy Study Group
- IBD, inflammatory bowel disease
- OD, optical density
- PsA, psoriatic arthritis
- RA, rheumatoid arthritis
- ROC, receiver operating characteristics
- SpA, spondyloarthropathies
- TNFα, tumour necrosis factor α
- uSpA, undifferentiated spondyloarthropathy
Anti-Saccharomyces cerevisiae antibodies (ASCA) are considered to be important as a serological marker for Crohn’s disease (CD), though their pathological role is not yet clear.1 ASCA are directed against the cell wall mannan of Saccharomyces cerevisiae, commonly known as baker’s or brewer’s yeast.2 Reactivity of sera from patients with CD has been described, regardless of the Saccharomyces cerevisiae strain used.2,3 Together with perinuclear antineutrophil cytoplasmic antibodies, ASCA can discriminate between CD and ulcerative colitis.3–6 Moreover, ASCA have been associated with distinct clinical subtypes of CD: the prevalence of ASCA is significantly higher in patients with small bowel disease (with or without colonic involvement) than in patients with pure colonic disease.4,7 Sensitivity and specificity for ASCA in CD range from 56%7 to 60%5,8 and from 88%5 to 95%,6 respectively. These specificities were calculated by comparing patients with Crohn’s disease with healthy controls or patients with other bowel diseases. The prevalence of ASCA in healthy controls ranges from 1% to 6%.9 In patients with diarrhoea but without inflammatory bowel disease (IBD) the prevalence of ASCA ranges from 5% to 15%.9 ASCA have also been reported in 20–21% of healthy relatives of patients with CD.10,11
Up to now, most authors have studied patients with non-IBD diarrhoeal illness as an inflammatory control group. No reports are available about incidence of ASCA in rheumatological diseases. Patients with rheumatoid arthritis (RA) can be tested as an inflammatory control group to exclude the possibility that ASCA reactivity is induced in a rather aspecific way during an inflammatory response.
We were interested in ASCA levels in patients with spondyloarthropathies (SpA) because there is a physiopathological relationship between CD and SpA. Subclinical bowel inflammation is present in up to 68% of patients with SpA and is related to locomotor inflammation. Seven per cent of these patients developed CD after 24–92 months.12–16 Furthermore, it has been demonstrated that even in gut biopsies of patients with SpA without histologically defined gut inflammation, the number of lymphoid follicles is increased, compared with controls.17
On the other hand, rheumatic manifestations are a common extraintestinal manifestation of CD. Thirty five per cent of patients with CD fulfil the European Spondylarthropathy Study Group (ESSG) classification criteria for SpA.18 ESSG criteria are fulfilled when a CD patient has peripheral synovitis or inflammatory low back pain.19
PATIENTS AND METHODS
Study group
We studied a group of 26 patients with CD. The diagnosis of CD was based upon clinical, endoscopic, and pathological findings. We included a group of 108 patients with SpA consisting of three subgroups: 43 patients with ankylosing spondylitis (AS) meeting the New York criteria for the diagnosis of AS20; 20 patients with undifferentiated spondyloarthropathy (uSpA), as defined by the ESSG criteria19; and 45 patients with psoriatic arthritis. These were patients with psoriasis and chronic inflammatory arthritis, negative for rheumatoid factor and fulfilling the ESSG criteria for SpA. Additionally we included 56 patients with RA, meeting the American College of Rheumatology criteria for RA21 and 45 healthy controls. Tables 1 and 2 show further patient characteristics.
Study group
Features of patients with AS and uSpA
In 18 patients with AS and 10 with uSpA a colonoscopy had been done in the past and biopsy samples were available (ileal biopsies in 23 patients, colon biopsies in 25 patients). These biopsy samples were screened for the presence of inflammation. Criteria used were described previously.22,23 In summary, acute inflammation was defined by the presence of neutrophils or eosinophils, or both, in the crypt and villus epithelium without alterations in the mucosal structure. In chronic active inflammation there was, in addition to architectural alterations, an active granulocytic infiltrate in the epithelium accompanied by an increased mononuclear cell infiltrate in the lamina propria. When either of these two types of inflammation was present, the result was considered to be “positive”. Regardless of the presence of active inflammation, the number of lymphoid follicles was counted.
ASCA levels were tested twice in 19 patients with SpA (10 AS, 1 uSpA, 8 psoriatic arthritis (PsA)), with a 12 week interval.
Serum was obtained through clotting by centrifugation of whole blood. Samples were stored at − 20°C until further analysis.
Detection of ASCA by enzyme linked immunosorbent assay (ELISA)
Commercially available kits from Medipan Diagnostica (Selchow, Germany), called “Medizym ASCA”, were used. Tests were performed according to instructions from the manufacturer. Briefly, serum was diluted 1:50, and was applied to the microtitre plates (100 μl per well) coated with cell wall mannan from a mixture of different Saccharomyces strains. The plates were incubated for one hour at 37°C. To remove unbound serum components, plates were washed five times. Thus, 100 μl of conjugate, specific for either IgG or IgA, coupled with horseradish peroxidase was added, followed by an incubation period of 30 minutes at 37°C. The plates were washed again five times, after which substrate was added (3,3′,5,5′-tetramethylbenzidine in citrate buffer containing hydrogen peroxide). Plates were incubated in the dark at room temperature for 10 minutes. The reaction was stopped using a stop solution containing sulphuric acid, turning the colour of the solution from blue to yellow. Plates were read at a wavelength of 450 nm.
ASCA IgG levels were determined by calculating a binding index using a cut off control: binding index=OD(sample)/OD(cut off control), where OD=optical density. ASCA IgA levels were determined using a standard curve, for which calibrators were supplied by the manufacturer. Study personnel were unaware of the diagnosis during these assays.
Total IgA levels
Total IgA levels were measured by nephelometry in a fraction of patients mentioned above: in 43 controls, 14 patients with CD, 26 patients with AS, 20 patients with uSpA, 9 patients with PsA patients, and 20 patients with RA.
Statistical analysis
Normality of the groups was obtained using a natural logarithmic transformation. Normality was tested with the Kolmogornov-Smirnov test and by visual analysis of a normality Q-Q plot. Groups were compared with the independent samples Student’s t test. For paired analysis a paired t test was used. For correlating different parameters, Pearson’s correlation coefficient was computed. When dichotomous data were considered, Pearson’s χ2 test was used. The level of significance was α=0.05.
A receiver operating characteristics (ROC) curve was generated by plotting sensitivity (y axis) against 1−specificity (x axis).
Statistical analysis was performed using SPSS software.
RESULTS
ASCA in CD
ASCA IgA levels were significantly higher in patients with CD than in both healthy controls and patients with RA (p<0.001) (fig 1). These results remained significant when ASCA IgA levels were corrected for total IgA levels (p<0.001). 10 (38%) patients with CD were positive for ASCA IgA using the cut off proposed by the manufacturer (20 U/ml). ASCA IgG levels were significantly higher in patients with CD than in non-inflammatory controls (p<0.001), and also compared with patients with RA (p<0.001). 8 (31%) patients with CD were positive for ASCA IgG using the cut off proposed by the manufacturer (ASCA IgG binding index=1). At least one of both markers was positive in 12 (46%) patients with CD.
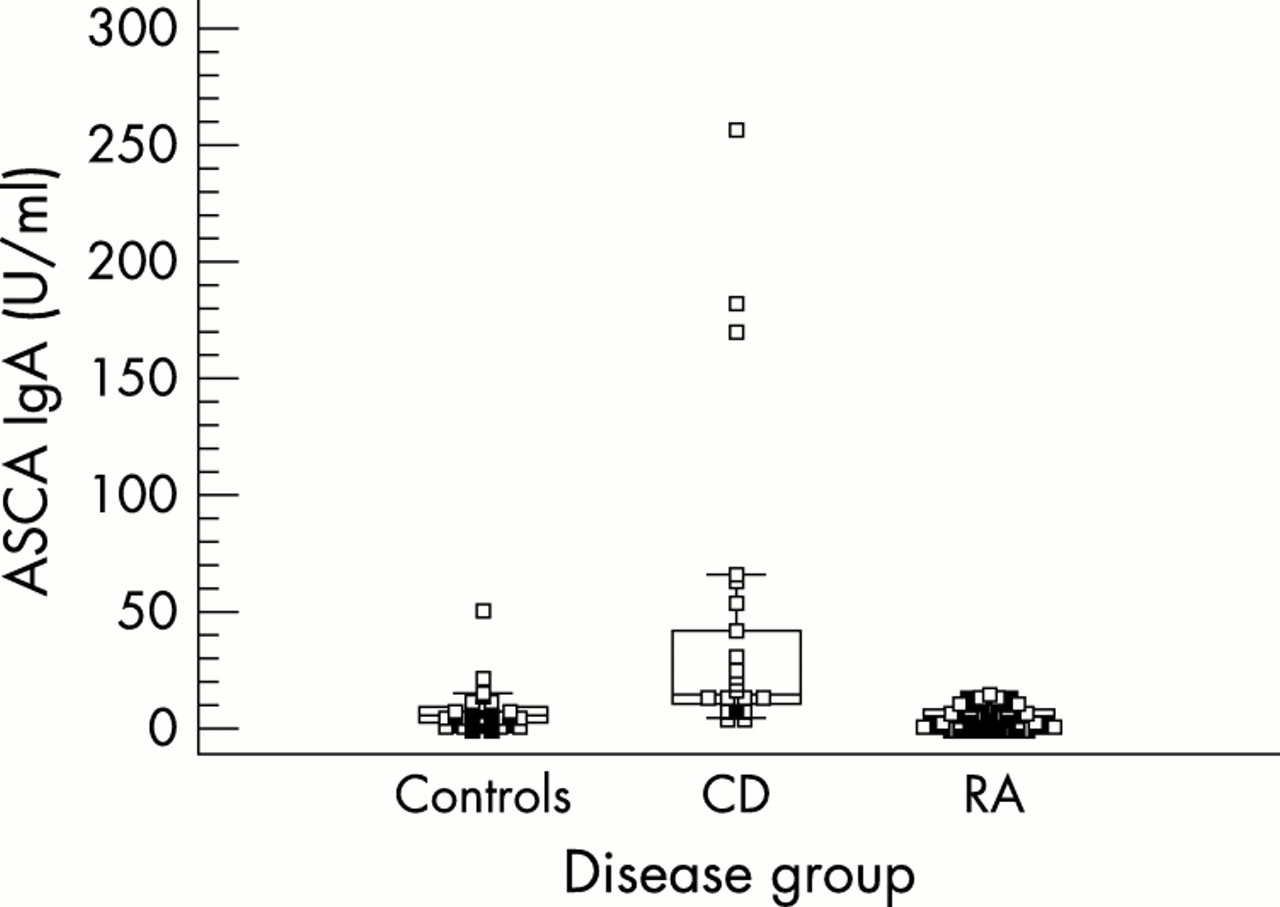
ASCA IgA levels for healthy controls, patients with CD, and patients with RA. ASCA IgA levels are higher in CD than in controls and patients with RA.
ASCA IgA in SpA
ASCA IgA levels were significantly higher in patients with SpA than in healthy controls and patients with RA (p<0.05). To exclude the possibility that these results were correlated with an increase in total IgA and thus reflected changes in total IgA, ASCA IgA values were corrected for total serum IgA levels. This correction did not change the significance of our findings.
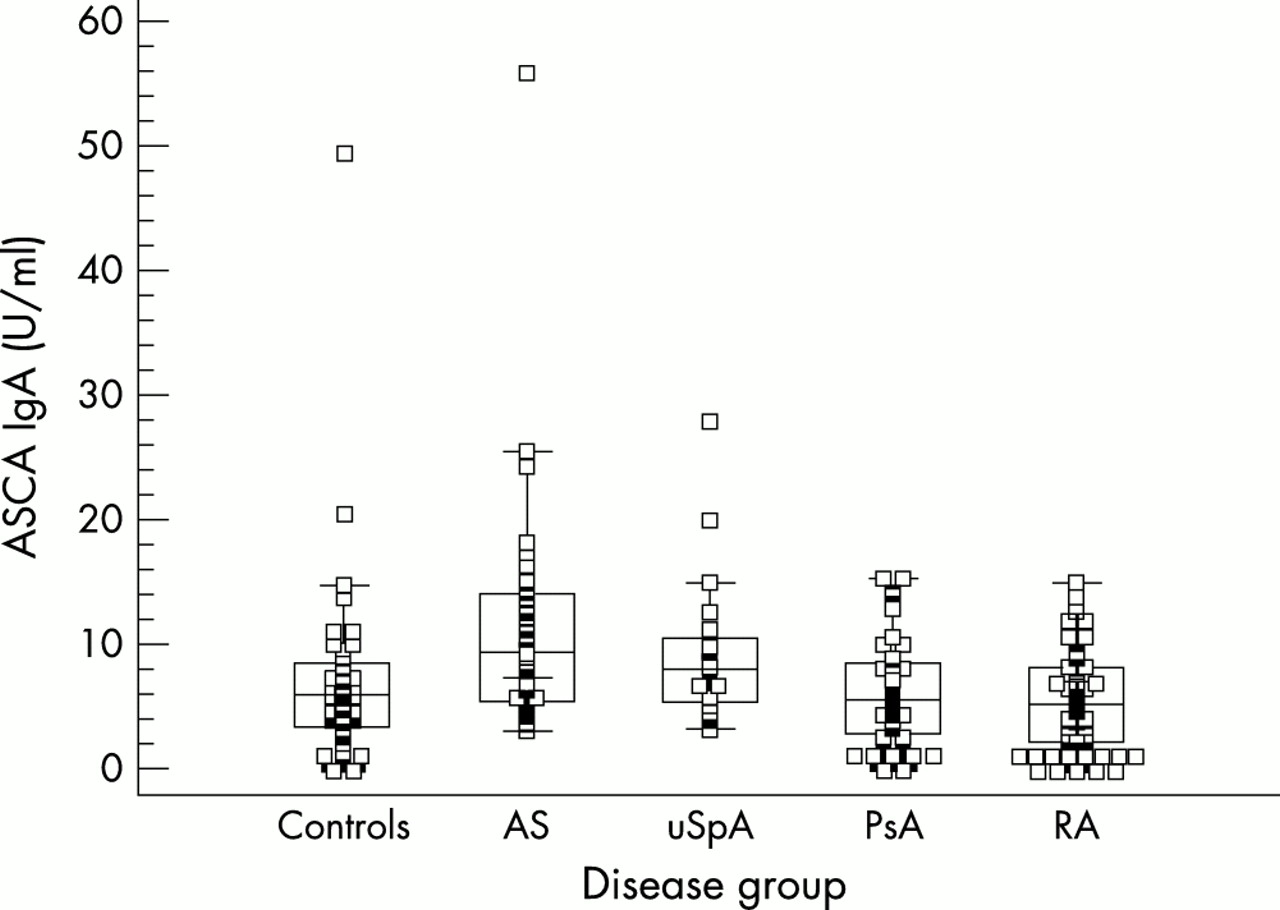
We split the group of patients with SpA into the different clinical subgroups. ASCA IgA levels were significantly higher in patients with AS than in healthy controls (p<0.001) and patients with RA (p<0.001). Furthermore, ASCA IgA levels were significantly higher in patients with uSpA than in healthy controls (p<0.05) and patients with RA (p<0.005). ASCA IgA levels in patients with PsA were not raised in comparison with ASCA IgA levels in healthy controls and patients with RA (fig 2).

ASCA IgA levels for healthy controls, patients with AS, uSpA, PsA, and RA. ASCA IgA levels are raised in AS and uSpA, but not in PsA.
ROC curve analysis for ASCA IgA
An ROC curve was plotted for ASCA IgA to evaluate sensitivity and specificity of the test in diagnosing AS or uSpA; healthy controls and patients with RA were used as controls (fig 3). This curve shows that with a cut off of 11 U/ml the sensitivity for detecting AS or uSpA is 38%, while the specificity is 90%. With a cut off of 20 U/ml as suggested by the manufacturer for the diagnosis of CD, sensitivity was 6%, while specificity was 98%.
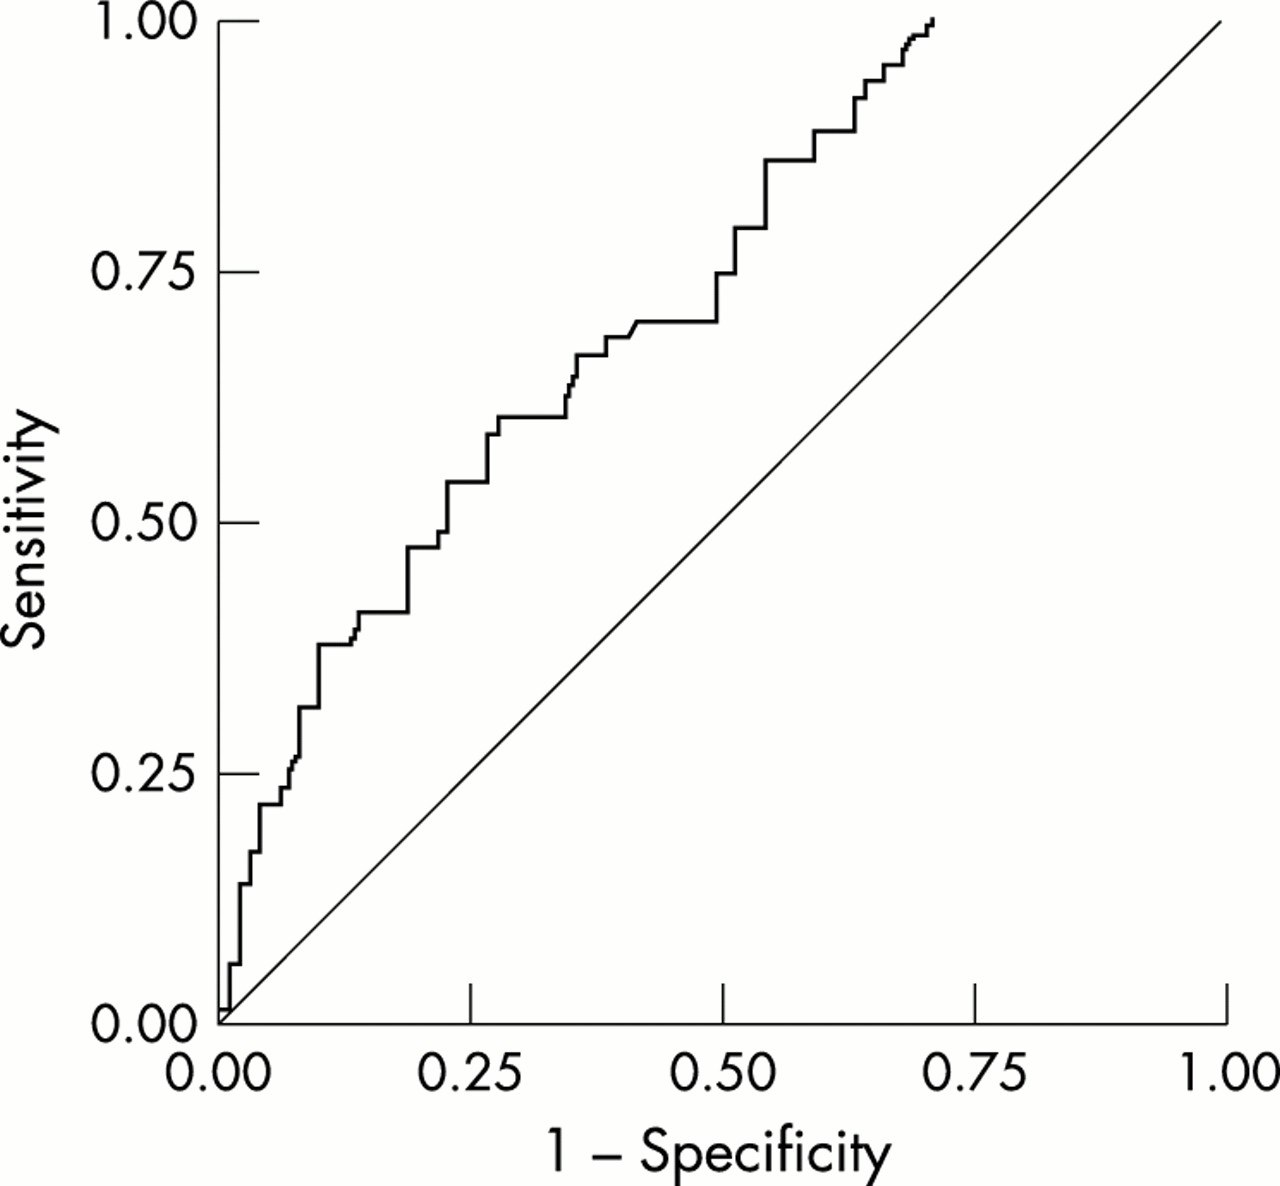
ROC curve for ASCA IgA, obtained by plotting sensitivity for detecting AS or uSpA (y axis) against specificity (x axis). Both healthy controls and patients with RA were used as the control group for determining specificity. Area under curve = 0.724.
ASCA IgA in patients with SpA with and without bowel inflammation
Eleven patients with SpA (six patients with AS, five patients with uSpA) and bowel inflammation were compared with 17 patients with SpA (12 patients with AS, five patients with uSpA) without bowel inflammation. No significant difference in ASCA IgA levels was noted between these two groups (p=0.930) (fig 4). If a cut off of 11 U/ml was used to define ASCA IgA positivity, 5/17 patients with negative gut biopsies were ASCA IgA positive, while 2/11 patients with positive gut biopsies were ASCA IgA positive. A χ2 test was not significant (p=0.503).

ASCA IgA levels in patients with SpA with and without bowel inflammation on gut biopsies. No significant difference is noted.
ASCA IgA in AS and uSpA: relation with follicle count
Because, on the one hand, the presence of lymphoid follicles is not considered to be a marker for active gut inflammation, and on the other, lymphoid follicle count is higher in gut biopsy specimens from patients with SpA,16 we also examined the lymphoid follicle count. The number of follicles in the ileum or colon did not differ between patients with high or low ASCA IgA levels when a cut off of 11 U/ml was used. Neither could a correlation between ASCA IgA titres and the number of follicles be noted.
ASCA IgA in AS and uSpA: relation with inflammatory status
A weak, but significant correlation was found between ASCA IgA and C reactive protein (CRP) levels (r=0.307, p<0.05) and between ASCA IgA levels and erythrocyte sedimentation rate (ESR) (r=0.332, p<0.05).
ASCA IgA in AS and uSpA: relation with HLA-B27
The HLA-B27 status was known in 36 patients with AS (29 were HLA-B27 positive) and in 10 patients with uSpA (five were HLA-B27 positive). No differences in ASCA IgA levels were noted between HLA-B27 positive and HLA-B27 negative patients.
ASCA IgA in AS and uSpA: relation with presence of peripheral synovitis
Peripheral synovitis was present in 25 patients with AS and in 17 patients with uSpA. There was no difference in ASCA IgA levels in patients with AS with peripheral synovitis, compared with patients with AS without peripheral synovitis.
ASCA IgA in SpA: variability over time
Nineteen patients with SpA were tested twice for ASCA IgA levels with a 12 week interval; no statistically significant difference was noted between the results at different time points; there was a paired correlation of 0.95 (p<0.001).
ASCA IgG in SpA
No significance was reached when the group of patients with SpA was compared with healthy controls or with patients with RA. When the group of patients with SpA was split into the subgroups AS, uSpA, and PsA, we could not demonstrate that ASCA IgG levels in any of these subgroups were significantly higher than in healthy controls or patients with RA.
DISCUSSION
Our present results confirm that both ASCA IgA and ASCA IgG levels are significantly higher in patients with CD than in healthy controls, as has been stated in previous reports.3–9 We also compared a group of patients with CD with patients with RA, serving as an inflammatory control group. Comparison of these two groups showed that there was still a statistically significant difference for ASCA IgA and ASCA IgG.
So far there have been no reports on the ASCA status in SpA. It seemed interesting to test for ASCA status in this patient group because of the clinical and pathological relation between SpA and CD; subclinical bowel inflammation is an important feature of SpA.12–16
Our present results show that ASCA IgA, but not IgG levels, are significantly higher in patients with SpA than in healthy controls or patients with RA. The differences remained significant when corrected for total IgA levels. Thus, ASCA IgA must be considered as the first serum marker associated with SpA. Because the SpA group is rather heterogeneous and the presence of different clinical subgroups might influence statistical analysis, we split the SpA group into its different clinical entities. We showed that ASCA IgA levels were significantly increased in patients with AS and in patients with uSpA, but not in patients with PsA, in comparison with healthy controls or patients with RA. Therefore, we focused on ASCA IgA levels in AS and uSpA.
We performed an ROC curve analysis to determine the optimal cut off for ASCA IgA in AS. As a cut off yielding a higher sensitivity of a test always results in a lower specificity of the test, choosing a cut off value is a difficult decision, and depends on the purpose for which the test will be used. However, it became clear that the cut off proposed by the manufacturer for diagnosing CD was too high if the test were to be used as a marker for AS or uSpA, yielding a sensitivity of only 6% with a specificity of 98%. But, if for instance a cut off of 11 U/ml was used for ASCA IgA, a sensitivity for diagnosing AS or uSpA of 38% is reached, while specificity is maintained at 90%. It is interesting to note that in a recent study, also for detecting CD, a lower cut off was suggested when using the Medizym ASCA IgA kit.9
We suggested that there might be a relation between the higher ASCA IgA levels seen in SpA, and the subclinical gut inflammation reported in patients with SpA.12–16 This hypothesis gained strength because of the fact that ASCA levels are not increased in patients with PsA, as in this patient group the presence of gut inflammation is lower than in AS or uSpA.24 We compared two groups of patients with SpA: 11 patients with microscopically confirmed bowel inflammation (six patients with AS, five patients with uSpA) and 17 patients without bowel inflammation on gut biopsies (12 patients with AS and five patients with uSpA). No statistically significant differences were noted for ASCA IgA. As an increased number of follicles is found in gut biopsies from patients with SpA without bowel inflammation,17 we checked for a correlation between ASCA IgA levels and the number of lymphoid follicles in gut biopsy specimens from patients with AS and uSpA. No significant correlations could be found. Thus we could not correlate ASCA IgA levels with any histological findings. Possibly, sampling error for the biopsies or the fact that serum samples were not always taken at the time of biopsy might play a part. It is also possible that in the so-called negative biopsy specimens prehistological changes were present.
It remains an open question, however, whether ASCA might be a prognostic marker in SpA associated with an increased risk for developing gut inflammation and CD. Prospective studies are warranted to investigate whether those patients with SpA with higher ASCA levels are those who will eventually develop CD. As the fraction of patients with SpA developing CD is only 7%, large cohorts will be needed. An interesting observation is that the single patient with uSpA who was both ASCA IgA and IgG positive, was in fact a patient with clear macroscopical and microscopical gut inflammation.
Within the SpA group, we demonstrated a significant correlation between ASCA IgA levels in AS or uSpA and CRP levels and ESR. We could not show any relation between HLA-B27 status and ASCA IgA levels in patients with AS or uSpA. Neither could we find any difference in ASCA IgA levels within the AS or uSpA group when comparing patients with and without peripheral synovitis.
Finally, we checked for variability over time. ASCA IgA levels were determined twice in 19 patients with SpA, with a 12 week interval. We noted a strong paired correlation between ASCA IgA levels at different time points, indicating that ASCA IgA levels are stable over time.
The present findings of ASCA IgA in SpA fit the concept that IBD and SpA are related disease entities, for which substantial evidence has been given. Up to now, several reports support the hypothesis that SpA might be a model for early IBD. Firstly, there have been the important observations that patients with SpA show subclinical gut inflammation.12–16 Furthermore, a similar increase in expression of the E-cadherin/catenin complex in acute and chronic active subclinical gut inflammation was demonstrated in patients with SpA25 and patients with CD.26 Up regulated αEβ7 integrin expression was found on gut mucosal T cells from patients with IBD27 and on gut mucosal T cell lines from patients with AS.28 There is evidence that an impaired Th1 cytokine profile has an important role in the pathogenesis of both SpA and CD.29,30 Finally, a common treatment has been proved to be effective in both CD and SpA: anti-tumour necrosis factor α (TNFα) therapy has been used successfully as a treatment for gastrointestinal symptoms of patients with CD,31 and also has a beneficial effect on articular manifestations of patients with CD.32 Recently, anti-TNFα therapy has been proved to be effective in the treatment of SpA.33,34 In our study we demonstrated that ASCA IgA levels are higher in AS and uSpA than in controls, though the levels are not as high as those seen in CD. This provides further evidence for the concept that SpA and IBD are related.
In conclusion, we confirmed previous reports that ASCA IgA and IgG levels are raised in CD in comparison with healthy controls and also with patients with RA. We demonstrated also that in patients with SpA, and especially in AS, ASCA IgA levels are higher than in healthy controls or patients with RA. We did not find raised ASCA IgG levels in SpA. We could not show a relation between ASCA IgA levels and gut inflammation, though larger prospective studies are warranted to demonstrate whether ASCA IgA or an isotype switch to produce ASCA IgG also might serve as a prognostic marker in AS, predicting CD.
Acknowledgments
The authors thank G Verbruggen and H Zmierczak for supplying serum samples.
This work was supported by a concerted action grant GOA96001 and by a grant from the “Bijzonder Onderzoeksfonds” (grant 011D3100), Ghent University, Belgium.