Article Text

Abstract
Aims: To determine bacterial loads in meningococcal disease (MCD), their relation with disease severity, and the factors which determine bacterial load.
Methods: Meningococcal DNA quantification was performed by the Taqman PCR method on admission and sequential blood samples from patients with MCD. Disease severity was assessed using the Glasgow Septicaemia Prognostic Score (GMSPS, range 0–15, severe disease ≥8).
Results: Median admission bacterial load was 1.6 × 10⁶ DNA copies/ml of blood (range 2.2 × 10⁴ to 1.6 × 10⁸). Bacterial load was significantly higher in patients with severe (8.4 × 10⁶) compared to milder disease (1.1 × 10⁶, p = 0.018). This difference was greater in septicaemic patients (median 1.6 × 10⁷ versus 9.2 × 10⁵, p < 0.001). Bacterial loads were significantly higher in patients that died (p = 0.017). Admission bacterial load was independent of the duration of clinical symptoms prior to admission, with no difference between the duration of symptoms in mild or severe cases (median, 10.5 and 11 hours respectively). Bacterial loads were independent of DNA elimination rates following treatment.
Conclusion: Patients with MCD have higher bacterial loads than previously determined with quantitative culture methods. Admission bacterial load is significantly higher in patients with severe disease (GMSPS ≥8) and maximum load is highest in those who die. Bacterial load is independent of the duration of clinical symptoms or the decline in DNA load.
- meningococcal disease
- bacterial load
- disease severity
Statistics from Altmetric.com
In the industrialised world meningococcal disease (MCD) remains the leading infective cause of death in children outside the neonatal period.1 The spectrum of clinical presentation is highly variable, featuring meningitis or septicaemia alone or a combination of the two. Patients with meningococcal septicaemia form a heterogeneous group, of whom 30% require intensive care therapy, and have reported mortality rates ranging from 6 to 75%.2,3 It is not fully understood why there is such a wide range in the clinical spectrum of MCD. Severity of MCD is positively correlated with the patients' serum cytokine concentrations, for example tumour necrosis factor α (TNF-α), interleukin 1β (IL-1β), IL-6, IL-12, and leukaemia inhibitory factor,4 and also with serum endotoxin (lipo-oligosaccharide, LOS)4 and serum meningococcal polysaccharide antigen concentrations.5 LOS initiates the cytokine cascade seen in severe MCD and thus potentiates disease progression. It is not clear whether LOS and antigen concentrations are proportional to bacterial load. This study examines the relation between bacterial load and disease severity in MCD.
Bacterial loads in the order of 104 and 105 colony forming units (CFU) per ml of cerebrospinal fluid or blood, respectively, have been shown in patients with MCD using a quantitative direct plating procedure (QDP).6 Patients with Haemophilus influenzae and Streptococcus pneumoniae infections with greater than 100 CFU/ml of blood (generally greater than 103 CFU/ml) were significantly more likely to have invasive disease (meningitis and epiglottis), compared to patients with fewer than 100 CFU/ml of blood (92% versus 9.5% respectively).7 This study did not show such a clear cut association between bacterial load and severe invasive disease for Neisseria meningitidis infections, although two fatal cases did have bacterial loads of greater than 103 CFU/ml of blood.7 Culture techniques will underestimate the true bacterial load as only viable organisms can be detected. This is illustrated by the fact that culture confirmation occurs in only 33% of clinically diagnosed MCD cases, yet meningococcal DNA can be detected in 88% of admission blood samples from the same patients (Hackett et al, unpublished data). This polymerase chain reaction (PCR) confirmation rate is consistent with data from the PHLS Meningococcal Reference Unit (MRU) for England and Wales, where 92% of culture proven cases were also PCR positive.8 The meningococcal DNA detected will obviously represent killed as well as viable meningococci, but will be directly related to bacterial antigen load.
METHODS
All children admitted to the Royal Liverpool Children's Hospital with a diagnosis of probable and possible MCD9 between January 2000 and January 2001, were seen at admission. Clinical history and examination as well as the results of laboratory investigations were recorded on a previously validated proforma, from admission until discharge. The clinical status of each patient was assessed, and all were stratified into mild or severe disease using the Glasgow Meningococcal Septicaemia Prognostic Score (GMSPS)10 from admission until they had stable observations or had been ventilated. GMSPS is a seven category score that ranges from zero to a maximum of 15: a score of ≥8 defines severe disease. In the analysis, patients' highest GMSPS were used. Only patients with MCD that was confirmed by Taqman PCR (51/58, 88% of all MCD cases) were included in this study. After informed consent, admission (n = 51) and sequential (n = 27) EDTA blood samples were obtained from patients with suspected MCD. For sequential sample analysis, only patients who had a minimum of three sequential samples obtained (a minimum of two had detectable meningococcal DNA) were included.
Meningococcal DNA detection and quantification was performed on all samples at the MRU using the Taqman PCR (Perkins-Elmer Applied Biosystems 7700 automated PCR platform, Norwalk, Connecticut). The Taqman assay, developed at the MRU, is able to detect and quantify meningococcal DNA in whole blood samples.8 Taqman amplifies a specific single copy capsular gene (ctrA) common to all N meningitidis serogroups. Real time PCR detection by Taqman (4–5 hours) provides accurate quantification of bacterial load over a range of 103 to 109 copies per ml. The quantification of DNA for all samples from individual patients was performed on a single plate using the same standards. The intra-assay variability was minimal as shown by CMV quantification which uses the sample DNA extraction and Taqman method,11 with significant variation (maximum 0.5 log-fold difference) only seen at low DNA concentrations (102 to 103). The bacterial load is expressed as genome copies per millilitre of blood. The lower detection limit is 103 copies per ml because only microlitre amounts of clinical material are assayed in each test. As each bacterium contains only a single capsular gene, DNA load equates to bacterial load. For this study, we use the terms interchangeably.
This study was part of a larger study of the pathogenesis of MCD and was approved by the Local Research and Development and Ethics Committees.
RESULTS
The median bacterial load in the 51 patients at admission was 1.6 × 10⁶ DNA copies/ml of blood (range 2.2 × 10⁴ to 1.6 × 10⁸). Patients with severe disease had significantly higher meningococcal DNA loads (n = 27, median 8.4 × 10⁶, range 2.2 × 10⁴ to 1.6 × 10⁸) than patients with mild disease (n = 24, median 1.1 × 10⁶, range 2.5 × 10⁴ to 1.3 × 10⁷) (Mann–Whitney, p = 0.018). The disparity between patients with mild and severe disease increased when patients with primarily septicaemia (without major symptoms and signs of meningitis) were looked at separately (median 9.2 × 10⁵ versus 1.6 × 10⁷, p < 0.001). This association of bacterial load and disease severity was also shown, as a continuous positive correlation, against all GMSPS values (Spearman's rank correlation 0.5, p < 0.001; fig 1).
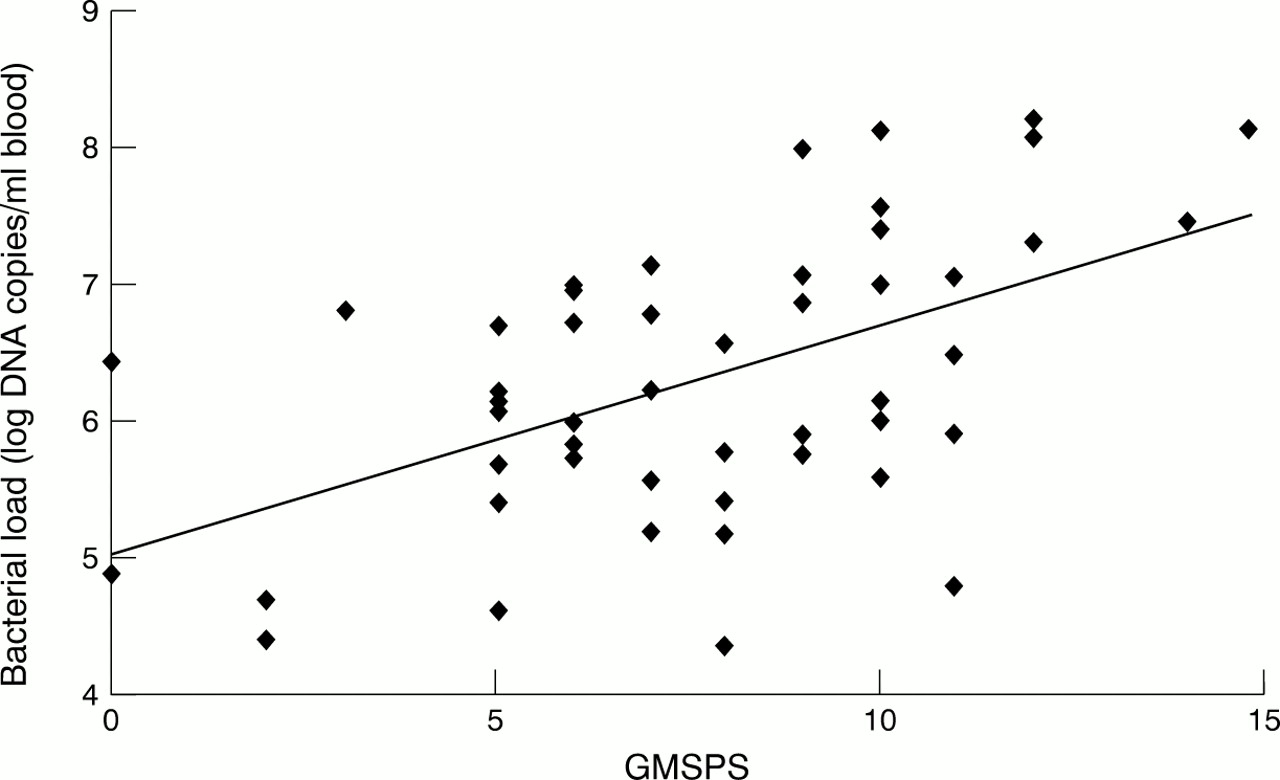
Correlation between admission bacterial loads and maximum GMSPS.
In seven patients, DNA load increased marginally within 16 hours of admission, to a maximum of 1.8 × 10⁹ and then decreased. These patients had severe disease (GMSPS ≥8) and their clinical conditions deteriorated notably after admission. The maximum bacterial load was significantly higher in the two patients that died (3.1 × 10⁸ and 1.8 × 10⁹) compared to survivors (Mann–Whitney, p = 0.017). When the maximum bacterial load for survivors and non-survivors in the severe group were compared, there was a trend towards difference that did not quite reach significance (p = 0.055).
The median duration of clinical symptoms (usually fever) prior to attendance at hospital and treatment was 10.8 hours (range 0.25–36 hours); in mild and severe cases it was 10.5 and 11 hours respectively. There was no difference in the duration of symptoms between mild or severe cases (Mann–Whitney, p = 0.534). Admission bacterial load and disease severity were not significantly associated with the duration of symptoms prior to attendance at hospital or treatment: temperature, vomiting, drowsiness/lethargy, macular or petechial rash, or time since onset of prodromal respiratory type illness (Spearman's rank correlation, p > 0.43).
Bacterial DNA was detectable up to 4.5 days following admission in sequential EDTA samples (range 22–109 hours, median 40). The decrease of DNA load in these sequential samples was highly variable. Patients who had very similar clinical pictures, who received comparable treatments, showed a notable difference in DNA clearance rates. The rate of decline in meningococcal DNA load over time was assessed using linear regression analysis (fig 2). There was no association between disease severity (Spearman's correlation, p = 0.66) or admission bacterial load (Spearman's correlation, p = 0.8) and the rate of DNA decline. One patient who did not have an immune deficiency during this study, had two infective episodes both caused by group B N meningitidis. The DNA elimination rates from both episodes, the first principally septicaemia and the second meningitis, were identical.

Linear regression analysis showing decline in bacterial DNA load from sequential EDTA samples.
DISCUSSION
We have shown that bacterial load at admission is far higher than had previously been appreciated in MCD when assessed by quantitative culture methods. Loads were also higher than has been shown in infections with other bacteria such as H influenzae or S pneumoniae.7 This is consistent with the results that bacteria DNA concentrations measured by Taqman PCR were up to 2-log fold higher than predicted when samples were inoculated with known quantities of colony forming meningococci from culture (M Guiver, personal communication).
The range of load measurements accords with recent findings that cytokine release from monocytes in vitro increases on stimulation by whole meningococci at concentrations from 105 to 108 bacteria/ml.12 At bacterial concentrations of 108, cytokine release from monocytes stimulated by both LOS expressing and LOS deficient bacteria were identical, indicating an LOS independent stimulation pathway. It was not explored whether bacterial concentrations greater than 108 would induce a greater LOS independent cytokine response, which could ultimately influence outcome.
The association of bacterial load with disease severity was predictable but had not been shown in MCD before. This association is strongest if patients with predominantly meningitis are excluded from the analysis (illustrated by a patient with meningitis where the load in the blood was 3 × 10⁵ compared to 5 × 10⁶ in CSF) and in the patients that died.
Several patients showed a transient increase in meningococcal DNA concentrations after admission and treatment. This presumably indicates that in some patients meningococci are sequestered in either peripheral white cells or on endothelial surfaces and then released into the circulation following antibiotic therapy.
We showed that disease severity and initial bacterial load at admission are independent of the length of clinical symptoms. Children with MCD are described as being “completely well” until they develop their first clinical symptoms, usually a raised temperature. The lack of a prolonged prodromal illness and the often abrupt onset of clinical symptoms possibly means that symptoms occur promptly following the initial bacteraemia. The doubling time for meningococci in culture medium is approximately 20–30 minutes. Under “ideal” conditions, therefore, the bacterial loads measured in our patients with severe disease (108 to 109) could be achieved in 10–15 hours, corresponding closely to the duration of symptoms prior to admission. It is probable that the hosts' response to infection is the major component determining multiplication rates for N meningitidis. It is unlikely that this is the result of differing innate growth rates of individual bacteria as the same strains of meningococci that circulate in any population cause severe disease in only the minority of patients who encounter them.13 Recent work has shown that TNF-α, IL-1β, and plasminogen activator inhibitor 1 gene polymorphisms are associated with increased mortality or with the development of septic shock in MCD.14–16
Disease severity and bacterial load are also independent of bacterial DNA elimination rates following therapy. DNA elimination rates following treatment could be affected by antibiotic and fluid administration, but this seems unlikely for three reasons. Firstly, the mechanisms of bacterial clearance, notably the reticuloendothelial system and phagocytes, are unlikely to be altered by our therapies. Secondly, patients with identical clinical pictures, who received similar therapies, showed a notable difference in DNA clearance rates. Lastly, the patient who had recurrent meningococcal B disease during this study, had identical DNA elimination rates on both occasions. The variable rates of DNA clearance between patients and their possible preservation in patient with recurrent episodes suggest that an individual's bacterial clearance mechanism is probably an innate idiosyncratic response.
Successful outcome in treating MCD is dependent on aggressive antimicrobial and supportive intensive care treatment. The addition of antiendotoxin or anticytokine therapies may improve outcome, but probably only in a selected group of patients (those with high endotoxin concentrations or bacterial loads). As endotoxin assays are laborious, the availability of a method that can rapidly measure bacterial load (presently 4–5 hours but new LightCycler PCR technology can yield results in 30–60 minutes) may in future be used as a prognostic marker to aid selection of appropriate specific therapies for treating MCD. What is unclear is whether more “virulent” meningococci liberate increased concentrations of LOS. Future work is needed to compare endotoxin concentrations directly with bacterial loads.
Acknowledgments
This study was supported by funding from the Meningitis Research Foundation, Meningitis Merseyside, and the Johanne Holly Research Fund. I would like to thank Dr Ian Campbell for his statistical advice throughout this project.