Article Text

Abstract
Microarray technology is a rapidly advancing area, which is gaining popularity in many biological disciplines from drug target identification to predictive toxicology. Over the past few years, there has been a dramatic increase in the number of methods and techniques available for carrying out this form of gene expression analysis. The techniques and associated peripherals, such as slide types, deposition methods, robotics, and scanning equipment, are undergoing constant improvement, helping to drive the technology forward in terms of robustness and ease of use. These rapid developments, combined with the number of options available and the associated hyperbole, can prove daunting for the new user. This review aims to guide the researcher through the various steps of conducting microarray experiments, from initial strategy to analysing the data, with critical examination of the benefits and disadvantages along the way.
- microarrays
- gene expression
- cDNA
Statistics from Altmetric.com
On the 26th of June 2000 the Human Genome Project and Celera jointly announced the completion of the draft sequence of the human genome. Likewise, the entire genomic sequences of an increasing number of organisms are currently being published. The value of these tomes of information will be fully realised when the function and control of genes, and their pathways, are elucidated. As a consequence of this burgeoning interest, the field of functional genomics has arisen, which encompasses the development and application of methods to examine the expression of large numbers of genes using a holistic approach, rather than on a “gene by gene” basis.
The regulation of gene expression occurs primarily at the transcriptional level1; hence the interest in developing techniques to measure differentially expressed genes via mRNA. Various methods of transcript profiling have been described previously, with the most well established being the northern blot. This technique has now been superseded by technologies that allow the simultaneous analysis of multiple genes. According to Granjeaud et al,2 microarrays have become the preferred method for large scale gene expression measurement.
What is a microarray?
There are currently two major platform technologies used for the analysis of gene expression: microarrays and “chips”. Microarrays, as developed in the laboratories of microarray pioneers such as Brown and Schena,3 comprise a large number of genes deposited on to a glass slide, which are used for a multiplex reaction—essentially a large scale dot blot. Nucleic acid (usually DNA) is spotted, in a grid arrangement, on to a solid support such as glass slides or nylon membranes. The microarrays serve as hybridisation targets for cDNA extracted from tissue or cell lysates. The RNA from the sample is reverse transcribed, with the simultaneous incorporation of label, and the resulting cDNA provides a signal when it binds to the complementary DNA. In this review, the spotted DNA is referred to as the target, whereas the labelled cDNA sample is called the probe.
The alternative technology available is made from oligonucleotide arrays synthesised in situ on a solid substrate (usually glass). This product is often referred to as a “chip”. This term was coined by the leading manufacturer, Affymetrix (Santa Clara, California, USA), who based their oligonucleotide synthesis process (photolithography) on the masking process used for silicon chip manufacture.4 They can be purchased off the shelf, with optimised protocols, or can be custom designed. This reduces the labour involved in producing and optimising an in house system and provides some assurance with regard to quality control. For small experiments the reduction in start up time can be advantageous. However, changing the design is an expensive process and this inflexibility, coupled with the cost, means that this platform is not well suited to academic or large scale use.
Ready made microarrays can also be purchased from vendors including NEN Life Science (Boston, Massachusetts, USA) and Clontech (Palo Alto, California, USA). Several companies, such as MWG Biotech (Ebersberg, Germany) and Genomic Solutions (Ann Arbor, Michigan, USA), are also advertising custom spotting capability. These are cheaper alternatives to the oligonucleotide chips, although the gene representation may be smaller. The most flexible approach is to establish in house production facilities, after which the cost of fabricating each array is approximately £50 (B Pennie, personal communication, 2000). This estimation excludes labour and start up costs. As the market for microarrays has expanded the increased competition between vendors has resulted in rapid technological improvements and lower costs. Because DNA microarrays are becoming more affordable they are gaining acceptance in academic and industrial laboratories, in a wide variety of fields. Owing to their increasing popularity this review will focus on microarrays, rather than oligonucleotide chips.
When to microarray?
Establishing a facility and the expertise to carry out microarray work is an expensive investment. Before committing resources it is worth considering whether other options are available that would be more suitable for the objectives of the experiments.
Microarrays are “closed systems” that enable the investigator to look at the expression of predetermined genes of interest spotted on to the microarray. To identify expression changes in novel, unknown genes within an entire mRNA population “open systems” are necessary. These include differential display, suppression subtractive hybridisation (SSH),5 serial analysis of gene expression (SAGE),6 representational differences analysis (RDA),7 and more recently, rapid analysis of gene expression (RAGE).8 They all have their various limitations. Alternatively, more expensive, contract gene “hunting” can be obtained, such as TOGATM from Digital Gene Technologies Inc (La Jolla, California, USA; http://www.dgt.com) and READS from Gene Logic Inc (Columbia, Maddison, USA; http://www.genelogic.com). Celera's (Rockville, Maddison, USA; http://www.celera.com) GeneTagTM profiling method is marketed as an open and quantitative method.
The ability to obtain qualitative results from microarrays is dependent on the specificity of the system. With stringent hybridisation and washing conditions only those genes with high homology should bind to the spotted targets. To validate or identify individual genes of interest, northern analysis (with a molecular weight read out as well as a specific binding event) or RNAse protection assays9 can be used. Heller et al used a 96 gene microarray in a quantitative fashion and validated the results with northern blots.10 A few other comparisons have been made—for example, with dot blot analysis.11 Microarray data demonstrate similar trends to these other methods, albeit with lower “fold” changes. It appears that the microarray data is “compressed”—presumably because of a smaller dynamic range. Other alternatives for quantitative gene expression monitoring include real time polymerase chain reaction (TaqManR PCR),12 which is currently considered the “state of the art”.
A further point to note is that many genes are expressed constitutively and the regulation of their function is at the translational or post-translational level. In many cases the regulation of transcription, or its relevance, is unknown. To date, there is a relatively poor correlation between gene and protein expression, and it is likely that global proteome analysis provides a better representation of the phenotype than does gene expression analysis.
The main advantage of microarrays over other transcript profiling methods is the ability to measure more than 100 genes simultaneously. As long as the capability and capacity to manage and analyse large volumes of data are available microarrays provide a rapid throughput and versatile tool.
Size fits function
Before embarking on making microarrays it is necessary to consider the intended function of the microarray and thus the style and size of the finished product. Two main approaches can be taken: (1) to include as many known genes as is possible for the system in question, or (2) to attempt to discern from the literature, or experience, which genes are the most relevant for the application. The former approach could be considered a “semi open” system, in which there is increased potential to obtain novel information on genes. For this application, large microarrays would be appropriate and the absolute accuracy of the sequences on the microarray will not be a major issue. An example of this type of approach is the investigation of yeast gene expression changes with metabolic state, where DeRisi et al used virtually every gene of Saccharomyces cerevisae.13
In contrast, the second approach is a completely closed system that will only provide results on strictly predetermined genes, which may already be well characterised. These microarrays will not be representative of the entire genome. The advantage of smaller size and reduced complexity is that it facilitates the task of making a high specificity, high quality microarray for quantitative use. This option is useful for focusing specifically on a mechanism of action, or for comparative studies where reproducibility and precision are important.
Heller et al combined both approaches in their study of rheumatoid arthritis and inflammatory bowel disease.10 They used a 1000 gene microarray containing randomly selected genes from a peripheral blood cDNA library, and also made their own specific 96 gene microarray. The larger microarray enabled them to investigate interesting expression changes in lymphocytes, whereas the quantitative, knowledge based microarray was used to profile the expression of cytokines, chemokines, transcription factors, and matrix metalloproteinases thought to be involved in rheumatoid arthritis.
Making microarrays
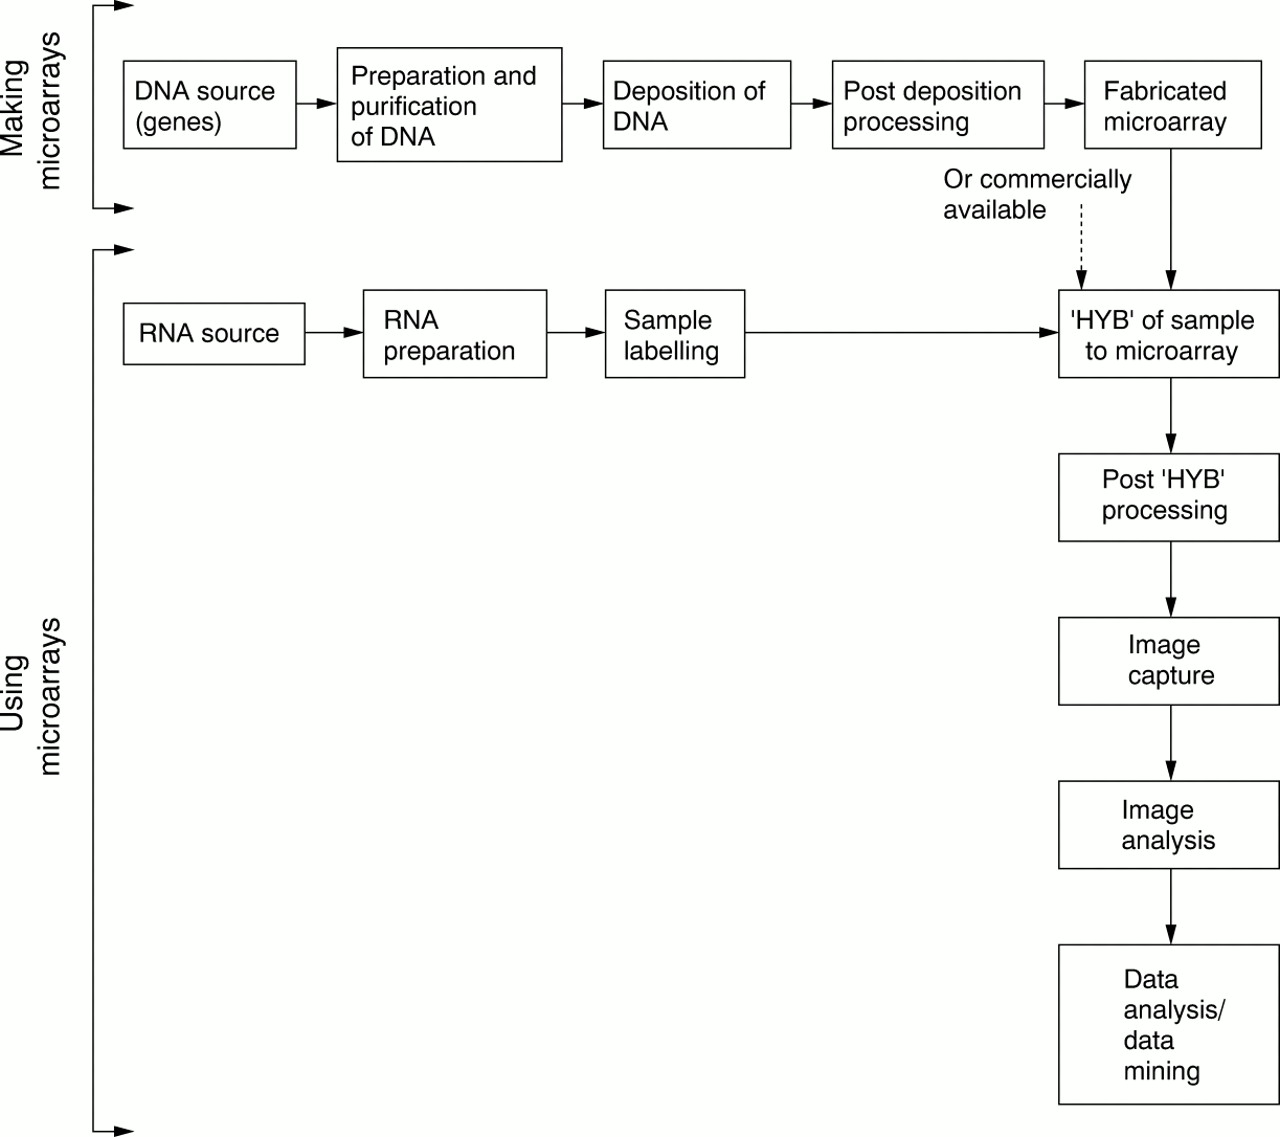
From a practical perspective, there are several consecutive steps that need to be followed to fabricate microarrays in house (fig 1).

Decision making points in microarray implementation. HYB, hybridisation.
SOURCING DNA/CLONES: WHAT TO SPOT?
The first step in creating a microarray is to source the genes or DNA that will be arrayed on a glass slide. There are a variety of approaches. One is to use publicly available clones such as those from the IMAGE consortium14 or Research Genetics (Huntsville, Alabama, USA) (see Bowtell15 for information on sources of clones). An advantage of this route is that a large number of clones can be obtained relatively inexpensively. Using a large pool of clones, rather than specifically choosing individual genes, has the advantage of reducing selection bias and might result in the discovery of novel gene interactions. The drawbacks of this approach include the quality of sequence, species availability, and bias towards highly expressed genes.
We have found that several IMAGE consortium clones contain inserts with poly(A) stretches and repetitive sequences. The clone inserts are also highly variable in length. Using these clones without subcloning or reprocessing might result in non-specific hybridisations and wildly different hybridisation kinetics between various genes.
In terms of availability, it is easier to find genes in the public domain that are highly abundant, commonly expressed in normal tissue/cells, and (for various technical reasons) easier to clone. Rare, low abundant transcripts or those thought to be important/patentable in developing therapeutics will be harder to source.
An alternative approach is to generate clones in house that are appropriate to the area of interest. This is proving popular, especially when combined with an open gene hunting method. Time and expense must be considered, but investment in quality at this stage pays dividends later in terms of confidence in results.
Microarrays are more specific when they are developed for one species. Obtaining clones of human genes is relatively easy because so much of the genome is already available. Finding clones of other species is more difficult. Furthermore, although there are several genes that share a high degree of homology across species, some genes can be very different. A good example is the glutathione transferase genes, which have different subunits in the rat compared with humans. In addition, the untranslated region of rat genes is often considerably longer than in human genes. This is a particular problem when using a cDNA approach from the poly(A) end of the mRNA because in the rat the reverse transcription enzyme may never reach the sequence that corresponds to the human gene.
The method used for generating labelled cDNA will determine the regions of the genes that are deposited. For reverse transcription methodology using poly(T) as a primer, sequences should be chosen closest to the 3′ end of the gene.13 Likewise, Heller et al chose sequences proximal to the 3′ end of the gene and selected for areas with least identity to related and repetitive sequences.10
When using gene specific primers for generating cDNAs, the region of the gene that is targeted should be the region that is most specific to that gene. Using random priming (for example, random hexamers) might cause additional problems, such as the amplification of residual genomic DNA.
It is worthwhile checking all sequences for overlaps in homology because this can result in a dilution of signal through competition. Closely related gene families are likely to cross hybridise. Heller et al found cross hybridisation between genes with 70–90% sequence homology and also between genes with short regions of identity over the length of the target.10 They minimised this problem by designing targets specific to gene family members.
Clontech is an example of a company that has made considerable investment in bioinformatics when designing arrays. The exact sequence of each clone is known and repetitive elements and poly(A) tracts have been avoided. Their cDNA labelling/amplification protocol uses specific primers so that sequences can be selected that are unique to the genes of interest. Table 1 overviews the various options available for spotting.
What to spot: options available
PREPARATION AND PURIFICATION OF DNA
Microarrays can be made by printing clones, plasmids, or most commonly, a section of the plasmid. The latter enables the relevant part of the plasmid DNA to be amplified by PCR and then spotted down in a purified and concentrated form. In practice, when spotting thousands of genes on microarrays the cDNAs are often amplified in a 96 well plate format. They can then be purified using a 96 well based method, such as that available from Qiagen GmbH (Hilden, Germany). Product purity is usually verified using an A260/280 absorbance measurement and gel electrophoresis. Multiple PCR products (that is, non-specific amplification of DNA) result in the deposition of heterogenous DNA and lead to non-specific hybridisations and meaningless data. Purification of all products is also important to remove contaminants from the PCR reaction.
SELECTION OF CONTROLS
As with any experimental system, the inclusion of relevant controls is essential for the meaningful interpretation of the data downstream. Controls can be used at several stages, but are most commonly used for normalising for differences in the sample labelling and hybridisation steps. The former issue is difficult to account for; differences in the enzymatic labelling step can be quite large (see sample labelling).
Some researchers use “housekeeping” genes. These are genes that are expressed constitutively and whose level of expression is thought to be stable, regardless of the sample used. DeRisi and colleagues16 used a panel of 90 housekeeping genes (http://www.nchgr.nih.gov/DIR/LCG/ARRAY/expn.html) for normalisation. They found some change of the level of expression in these “standards”, so that only changes greater than 3 SD from the log mean ratio were considered to be meaningful. Thus, ratios of “fold” changes that were < 0.52 and > 2.4 were considered acceptable.
Although DeRisi et al validated the use of housekeeping genes in their experiments,16 there is very little literature available on which to base the notion of “housekeeping genes”. For example, although the expression of β actin was unchanged in their tumour suppression experiments, it has been shown to be demonstrably downregulated in heat shock experiments with Jurkat cells.17 In fact, there is an appreciable amount of literature available to suggest that there is no such thing as a housekeeping gene.18 Relying on this method of standardisation might well cause problems in experiments where it is difficult to predict the affect on any chosen gene.
Another alternative method for accounting for differences in probe labelling is to “spike” the RNA preparation with a synthetic mRNA. This may be created from in vitro transcription from a clone. Ideally, the control mRNA would be from a different species and would only bind to its complementary DNA, which is also spotted on to the microarray. Schena et al used controls from Arabidopsis thaliana, at dilutions of 1/100000, 1/10000, and 1/1000 (wt/wt), spiked into the reverse transcription of human total RNA.11 They do not seem to have considered this as a calibration schema, but note that there is no hybridisation to arabidopsis negative controls. Similarly Schena et al used human acetylcholine receptor mRNA to establish a sensitivity limit, and used rat and yeast genes as negative controls in a study using yeast.3 Wherever possible, care should be taken that control genes are not homologous to genes present in the sample. In our experiments, we found that a probe from rat liver was homologous to all five yeast genes that we were intending to use as controls (unpublished results, 1999). An ideal solution would be to use several different non-homologous control genes at different concentrations, so that resulting hybridisation signals can be used for calibration between different reverse transcriptions.
The second type of standardisation concerns the hybridisation step. When the deposited DNA is of dubious quality, or thought to contain repetitive sequences or poly(A) tracts, it is useful to ensure that the hybridisation conditions are sufficiently stringent. Negative controls such as plasmid vector sequences, total DNA (especially of another species), Cot1DNA, and poly(A) can all be spotted on to the array.16 Ideally, under the correct hybridisation conditions (see hybridisation of sample to microarray) no sequences will bind to these areas.
Another way of controlling for differences in hybridisation conditions is to use two labels during the probe preparation step. This accounts for the hybridisation microenvironment, and also for differences between spotted DNA on different microarrays. Two different samples (usually control and treated), fluorescently labelled with different dyes, are hybridised to the same microarray. The microarray is scanned at two different wavelengths to obtain signals for both dyes, and the results are expressed as a ratio of the two signals. However, different fluorescent labels are likely to be incorporated with different efficiencies during the reverse transcription process, so the labelling reaction is often performed twice, swapping the dyes for control and treated samples. An average is then taken of the two values. One disadvantage of this method is that it is very difficult to match two dyes. For example, although Cy3 is a useful fluorophore, the half life of Cy5 is much shorter under standard laboratory lighting conditions, so that care must be taken in performing two experiments within the same time period.
In addition, cross talk between dyes (this can occur even when dyes are scanned separately if there is excitation spectra overlap) can be problematic.19 The method is useful, and widely practised, but it is important to note that it does not compensate for differences in the probe preparation step.
DEPOSITION OF DNA
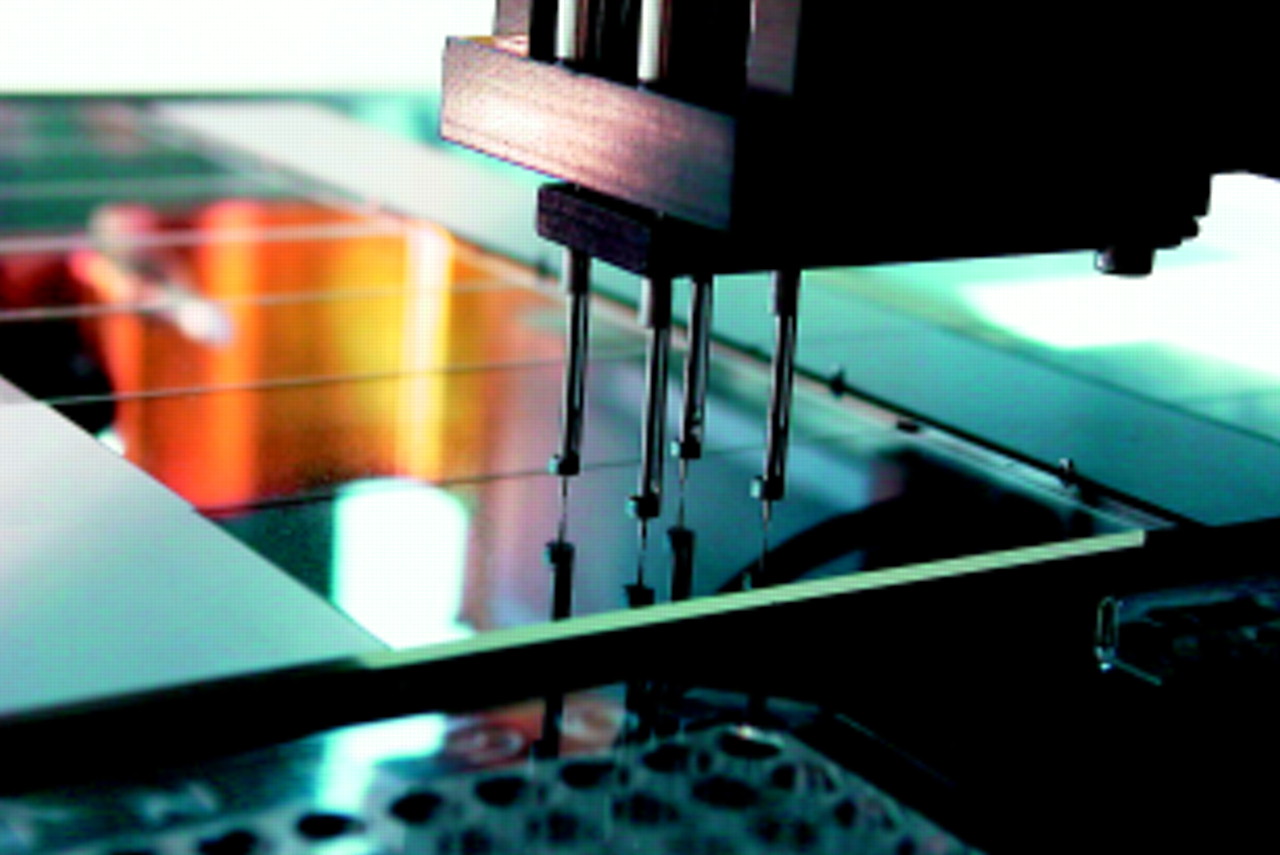
Deposition can be categorised into contact or non-contact printing. Contact printing involves using a robot to “spot” down nanolitre droplets of DNA in solution. There are several spotting robots on the market, with a variety of spotting tip designs. These include split (channelled) pins, flat ended pins, and “pin and ring” technology (fig 2). For a good review on spotters see Bowtell.15 To date, spotting robots have been the most practicable technology for in house use, although non-contact methods such as bubble jet20 and ink jet21 printing are becoming more accessible and affordable (for example, via Packard Instrument Co, Meriden, Connecticut, USA). These have the potential for accurate and even spotting, although issues regarding cross contamination between different DNA samples need to be dealt with.
Genetic Microsystems' (GMS) 417 “pin and ring” spotting robot.
Deposition of the PCR products or clones can be on glass, nylon, or other supports. There are numerous methods used—for example, non-covalent attachment via poly-L-lysine coated glass slides,16 or covalent attachment, such as the silyl chemistry used by Schena et al.11 Typically, 0.5–10 nl of DNA is deposited in a spot 100–150 μm in diameter, and a distance of 200–250 μm from neighbouring spots. The exact dimensions and quality of spots are dependent on the type of robot and the settings used. The type of pen tip will affect spot quality—those with “quills” might clog easily with viscous solutions or with dust.19
It is imperative that the DNA is pure, and deposited in excess. Ideally, all the PCR products should be of similar concentration/molarity (approximately 500 ng/μl for glass19) and size, to achieve similar reaction kinetics for all hybridisations. The ideal length deposited is often debated, but Heller et al found no significant difference in hybridisation signal for products ranging from 0.2 to 1.2 kb.10 There may be some advantages gained by spotting single stranded PCR products—for example, preventing self hybridisation. Watson et al identified about a twofold increase in signal when using single stranded, rather than double stranded, DNA but they emphasise the necessity of identifying the correct strand for deposition.22
The microenvironment used for microarraying is also important—several researchers use high efficiency particle arresting filtered air (to reduce airborne contaminants) and humidity controlled chambers.19 Humidity determines the rate of evaporation of water from the arrayed spots. Rapidly dried spots may be uneven, with most of the DNA in the centre, whereas slow drying might result in creeping, and spot spreading. Spot quality, as defined by a perfect circular shape with an even density of DNA, is important. Irregular shapes and uneven signal can cause great problems for analysis, and reproducibility between spots of different replicates is essential for interpretation.
Deposition methods are seldom published in detail (except Cheung and colleagues19), although a limited number are available on Pat Browns' website (http://cmgm.stanford.edu/pbrown), and some vendors will provide protocols. Several user groups have been established for the discussion of optimised protocols—for example, Amersham Pharmacia's (Amersham, Buckinghamshire, UK) Microarray Technology Access Programme (MTAP). While individual laboratories independently strive for the best signal and lowest background readings on glass slides, several slide vendors are developing new technologies, such as orientated deposition (http://www.hooked.net/~telechem) and metal coated slides, to deal with these problems.
POST DEPOSITION PROCESSING
After printing, it is suggested that slides should be left for 24 hours at room temperature to permit thorough drying of the DNA. The deposited DNA is then immobilised, usually by UV irradiation. Alternatively, spotted slides can be oven baked at approximately 80°C for two to four hours. Once immobilised, the remaining post deposition processing will be dependent to a large extent on the spotting process that has been used. Using silylated slides, Schena et al rehydrated the spotted DNA before rinsing with sodium borohydride and ethanol.11 When using glass it is common to wash the slides with solvents to remove contaminants, such as grease and any loosely attached DNA. This is followed by a boiling step to denature the DNA.
Using microarrays
RNA PREPARATION
There are several issues concerning RNA and its preparation that are worthy of consideration. These include cell heterogeneity, tissue extraction, and RNA integrity. The RNA source may be from cell culture or from tissue, including tissue banks and biopsy specimens. In general, preparation from cell culture is often considered easier and more reproducible. When measuring the effect of drugs or disease, it has been noted that the pathological processes and drugs themselves (for example, highly necrotic tissue or tissue/cells treated with transcriptional inhibiting compounds) can interfere with mRNA expression. In addition, the type of tissue might have a profound effect on the extraction process—for example, mRNA extracts from liver are of higher quality than those obtained from stomach. To enable reasonable (500 bp) lengths of cDNA to be transcribed the extracted RNA must be of high quality. Tissues of potential interest for gene expression analysis should be snap frozen in liquid nitrogen immediately after harvesting, and stored at −80°C.
SAMPLE LABELLING
A single round of transcription is used to generate a labelled cDNA probe from the sample. Fluorescent or radioactively labelled probes can be made from either total RNA or purified mRNA. Duggan et al suggest 50–200 μg of total RNA/slide or 2–5 μg of poly(A) mRNA.23 The quantity of RNA required may place a limitation on experiments, especially if tissue is scarce or only one cell type has been isolated—for example, by laser capture microdissection (LCM). This problem can be circumvented for fluorescence by using a probe preparation step that incorporates a PCR step, rather than reverse transcription alone. However, because standard PCR is not linear this can lead to problems of quantitation. It might also selectively amplify some genes, leading to non-representative expression profiles; hence, other, non-PCR based methods of amplifying the nucleic material may be preferred.24 Alternatively, greater sensitivity can be obtained by using radioactive labelling. P33 labelled cDNA on filter arrays requires only 50 ng of total RNA for each experiment.23
In our experience, the labelling step is the primary cause of lack of reproducibility in experiments.25 The complex biological reaction is prone to error owing to differences in quality and quantity of the constituent ingredients. One example of this is the transcriptional enzyme, which is stored in glycerol and thus difficult to pipette accurately. Enzymes such as superscript are fragile: they have a short half life at room temperature, and activity can be substantially reduced by raised temperatures and frothing caused by over zealous pipetting.26
Methods for sample labelling are dependent upon both the slide type and the detection equipment. Radioactivity is often used with nylon membrane arrays, whereas fluorescent labelling is generally used with glass. Incorporating fluorescent label during the reverse transcription reaction might have an affect on the efficiency of the enzyme, potentially leading to truncated transcripts. If only one nucleotide is labelled then there may be a transcriptional bias.
Dual label hybridisation is a technique often used to compensate for differences in spotted genes. Two samples are labelled with paired fluorophores that are competitively co-hybridised. Cy3 and Cy5 are the most commonly used fluorophores,13 mainly for historical reasons, although other combinations include fluorescein and lissamine3 and Cy3 and rhodamine.16
After preparation, labelled samples are purified to remove contaminating fluorescent nucleotides or debris. Cellular protein, lipid, and carbohydrate can cause fluorescent contaminating particulate matter.23 Purification is usually carried out using filter spin columns (such as Qiaquick; Qiagen) or gel chromatography columns (for example, Biospin 6; BioRad, Hercules, California, USA). Occasionally, an additional ethanol precipitation may be performed.16
HYBRIDISATION OF SAMPLE TO MICROARRAY
This step may also give rise to considerable variation, depending upon the support and the chemistries used for deposition. The surfaces with deposited DNA are easily damaged at this stage. In particular, membranes may be abraded, resulting in uneven and high backgrounds. Glass microarrays are often hybridised by spotting a small volume of sample (for example, 20 μl) on to the microarray and then carefully dropping a coverslip on to it. This has the effect of spreading the solution over the entire slide and eliminating air. Sealant can then be applied around the periphery of the coverslip to prevent dehydration of the solution. Problems with this method include seepage of the sealant underneath the slide (causing high backgrounds) or the incorporation of air bubbles. Alternative approaches are to use humidity chambers for the incubation step (thus obviating the need for sealant) or to use hybridisation (sealed) chambers. TeleChem International Inc (Sunnyvale, California, USA) and Clontech manufacture hybridisation chambers to reduce evaporative loss of samples from the slides. Amersham Pharmacia has developed a hybridisation station with agitation of the sample solution. This mixing is intended to provide even coverage and hence even hybridisation. In our own laboratory, we have improved replicate reproducibility by 40% by using chambers designed in house that enable free flow of the hybridisation solution over the microarray.
The speed, extent, and specificity of hybridisation are dependent on the stringency of the hybridisation solutions. This is a function of the salt concentration and temperature. The most commonly used hybridisation solution is sodium citrate buffer and saline (SSC) with the addition of detergent, although others are commercially available (TeleChem: http://www.hooked.net/~telechem; Clontech: http://www.clontech.com). Several researchers use additives in the hybridisation solution to reduce backgrounds. These include Denhardt's reagent, sheared salmon sperm, Cot1DNA, tRNA, and poly(A). To improve binding at low copy number formamide, dextran sulphate, or polyethylene glycol can be used.
The time and temperature for hybridisation are a function of the hybridisation solution and the complexity and length of the sample DNA. The optimum (maximum rate) hybridisation temperature should be about 20–25°C below the melting temperature (Tm). The Tm can be approximated using the following equation derived from solution hybridisation kinetics.27
Where M is the monovalent cation concentration, %G+C is the percentage of corresponding nucleotides in the probe, and L is the number of nucleotides in the DNA hybrid. When no formamide is used in the hybridisation this part of the equation is ignored.
It is important to note that fluorescent dyes may reduce the Tm value of the probe and it is best to determine the optimum hybridisation temperature experimentally by increasing the stringency of the hybridisation and washes until specific binding is obtained. The specificity can be monitored using negative controls (see selection of controls). The deposition chemistry should also be considered when calculating hybridisation time. For example, the surface of silane coated glass may deteriorate after prolonged incubation (> 10 hours) at temperatures above 50°C.
POST HYBRIDISATION PROCESSING
After hybridisation, the microarrays are subjected to a series of washes to remove unbound, labelled probe and non-specifically bound sequences. The wash solution is usually of similar composition to the hybridisation solution. More stringent conditions are often applied during the final washes, either by increasing the temperature or lowering the ionic strength of the buffer. Washing should take place under conditions of salt concentration and temperature that are equivalent to between 5°C and 20°C below the Tm27 (see hybridisation of sample to microarray).
IMAGE CAPTURE AND IMAGE ANALYSIS
As discussed earlier (see sample labelling), the type of detection equipment used will determine the labelling method. Film or phosphor imaging plates (Molecular Dynamics Inc, Sunnyvale, California, USA) are used for radioactivity, whereas optical systems are used for fluorescently labelled samples. Over the past two years there has been a considerable increase in the number of commercially available microarray scanning instruments and a concomitant decrease in price. Although the number of wavelengths available is still somewhat limited, rapid, high resolution scanners are now available from as little as £30 000. Factors to be considered when buying a scanner include compatibility with spotter slide format, throughput, technical support, and the ability to access the output data.
Some detection equipment is supplied with vendor software for analysis of microarrays—for example, QuantArray from GSI Luminomics (Packard Biochip Technologies, Billerica, Massachusetts, USA). Independent software specifically designed for the market may have superior properties and additional capabilities. For example, Imaging Research Inc (Ontario, Canada) make ArrayVisionTM for image analysis, together with ArrayStatTM for statistical analysis. BioDiscovery Inc (Los Angeles, California, USA) sell two types of image analysis software, one of which (Autogene) is specifically for higher throughput automated analysis of images. Some free image analysis software is available on the internet—for example, NIH Image (http://rsb.info.nih.gov/nih-image, developed at the US National Institutes of Health) and ScanAlyse 2 (from Stanford University at http://rana.standford.edu/software). Important criteria for image analysis software include speed, ease of use, automation (especially of spot finding), and the ability to distinguish artefact from real signal.
When scanning the slides, each microarray may be scanned several times depending on the number of fluorophores being used for labelling (see selection of controls). It is important to establish that this does not cause photobleaching of the fluorophores.
ANALYSIS OF DATA/DATA MINING
As technical problems have been dealt with over the past few years the bottleneck for development has moved downstream. Despite the volume of data produced, few authors consider issues such as robustness and reproducibility. There are seldom more than two replicates of each experiment, meaning that statistical significance cannot be calculated. However, the rudiments of data analysis are beginning to be established.
It has been recognised by microarray users that the first step in analysis of the data is the log transformation of the data. This is because the values from instruments, such as scanners, are often biased to small values, with few high values.
Another important step in data analysis is normalisation of the data. Problems such as variability between hybridisations are circumvented to some extent by using dual hybridisation of the test and control samples. Rather than obtaining absolute values a ratio of test to control is obtained. This normalisation is often achieved, not at the data stage, but during the scanning, when the laser voltage is adjusted to obtain a similar dynamic range from the fluorophores. The sensitivity of detection is adjusted according to either all of the genes in the sample, or to a designated subset of genes that are expected to remain unchanged.23 This method is limited to conditions when most genes do not change between samples.
Other methods of normalisation include expressing each gene as a percentage of the total signal on the microarray. Again, this works best when few genes change, and assumes that as many genes should be downregulated as upregulated, which is seldom the case. In addition, noise may be erroneously included as signal, leading to potential difficulties in analysis. Gene values can also be expressed as a percentage of their historical value,28 or relative to the expression of another gene, such as a control. Dependency on control genes can be problematic (see selection of controls) but promising strategies for normalisation are the subject of research.29 In the absence of control genes, standardising to the median microarray value is proving popular. We are currently investigating additional mathematical methods of data transformation to account for differences between microarrays.
Analysed gene changes are often expressed as a fold increase, either greater than twofold or less than 0.5-fold. This cut off value, possibly derived from the work of DeRisi and colleagues16 with respect to their arrays, has been taken as the limit of what is considered a reasonable threshold, whereas in fact, with a large number of microarrays, small changes can be statistically valid. For example, we can detect changes of 1.1-fold with 95% confidence intervals when each experimental sample is hybridised to seven microarrays (with two replicate spots for each gene).
Data can be visualised with software such as GeneSpring (Silicon Genetics, San Carlos, California, USA) and SpotFire Array Explorer (SpotFire Inc, Cambridge, Massachusetts, USA). These packages also have tools for clustering. The data are posing an interesting problem in the field of data mining because of the data quality, the volume, and the huge dimensionality. The number of variables (often thousands) greatly exceeds the number of cases. The large number of dependent variables (genes) means that standard statistical tests such as ANOVA/MANOVA and t tests are not ideal for this type of data. Hence, new methods for multivariate analysis are under development (W Wu et al, 2000, unpublished data). Methods used to date mainly focus on clustering genes associated with a given pathology.30 Eisen et al have developed two methods called Cluster and TreeView (http://rana.stanford.edu/software).
Future developments
Over the past few years microarray technology has been transformed from the realms of fantasy to reality. The use of microarrays is becoming the “norm”, not the exception, and there has been a shift in emphasis from the development of the technology towards its implementation. Researchers can now focus on applications such as drug development and disease profiling using readily available products.
Microarrays are becoming recognised as a powerful tool for examining global gene expression and they are no longer implemented in isolation, but in conjunction with other techniques such as LCM.31 In our laboratory, we parallel cDNA microarray technology with proteomics to gain a more global understanding of the molecular mechanisms involved. Protein chips made by Ciphergen (Fremont, California, USA) based on surface enhanced laser desorption ionisation (SELDI) technology32 are currently under investigation.
Although the current trend is to generate microarrays with as many genes as possible, there may well be a divergence from this, fuelled by experimental objectives and applications. The future may see large, high density microarrays and chips manufactured for gene hunting type experiments, with smaller, higher quality “boutique” microarrays being made for specific applications. Gene hunting technologies such as RAGE and SSH are likely to become increasingly popular to provide the optimal genes for smaller specific arrays. In terms of commercial products, more microarrays will be developed that are targeted at specific areas of research and, faced with ever increasing competition, vendors are likely to focus on niche markets.
As the interest and experience in this technology expands there will be a concomitant increase in the number of innovations and improvements. These will be incremental—for example, improved labelling techniques—and also radical, such as providing new support formats. The current plethora of patents and licensing issues in the microarray community is already stimulating alternative method development. There is huge potential in combining microarrays with other “lab on a chip” technology, such as non-pumped fluid handling. Improvements will result in increasingly reproducible, sensitive, quantitative, and robust microarrays. If any techniques prove to provide a cheaper and/or more reproducible option, then researchers will use the favoured method. One example of this may be in sourcing DNA for spotting, where the use of PCR products is likely to wane and be replaced by the use of presynthesised, purified oligonucleotides. Optimal sequences can be selected using bioinformatics from published genome sequences. Generating oligonucleotides for deposition is faster and there is greater quality control over the DNA product than can be achieved by cloning genes and preparing PCR products. In addition, hybridisations from oligonucleotide microarrays are likely to be more reproducible and predictable.
One major area for growth is in data handling and analysis. Several groups, such as the European Bioinformatics Institute33 and the International Life Sciences Institute (http://www.ilsi.org) are establishing databases for accommodating public data. The difficulty in combining data from disparate sources and different platform technologies cannot be underestimated. Long term, these ambitious projects might have to focus on either one platform technology or using only processed results for individual subject areas. These could then be collated together with information from other sources such as biochemistry, pathology, histology, and proteomic analysis to generate hypotheses. Real value is likely to come from having a spectrum of both established and novel techniques that can be used together to characterise phenotype.
Acknowledgments
Thanks to P Wolstenholme for supplying the photograph of the GMS 417 spotter and to B Morrison III and P Bugelski for useful comments on the manuscript.