Article Text

Abstract
Aims Lynch Syndrome is caused by mutations in DNA mismatch repair (MMR) genes. Mutation carrier identification is facilitated by immunohistochemical detection of the MMR proteins MHL1 and MSH2 in tumour tissue and is desirable as colonoscopic screening reduces mortality. However, protein detection by conventional immunohistochemistry (IHC) is subjective, and quantitative techniques are required. Quantum dots (QDs) are novel fluorescent labels that enable quantitative multiplex staining. This study compared their use with quantitative 3,3′-diaminobenzidine (DAB) IHC for the diagnosis of Lynch Syndrome.
Methods Tumour sections from 36 mutation carriers and six controls were obtained. These were stained with DAB on an automated platform using antibodies against MLH1 and MSH2. Multiplex QD immunofluorescent staining of the sections was performed using antibodies against MLH1, MSH2 and smooth muscle actin (SMA). Multispectral analysis of the slides was performed. The staining intensity of DAB and QDs was measured in multiple colonic crypts, and the mean intensity scores calculated. Receiver operating characteristic (ROC) curves of staining performance for the identification of mutation carriers were evaluated.
Results For quantitative DAB IHC, the area under the MLH1 ROC curve was 0.872 (95% CI 0.763 to 0.981), and the area under the MSH2 ROC curve was 0.832 (95% CI 0.704 to 0.960). For quantitative QD IHC, the area under the MLH1 ROC curve was 0.812 (95% CI 0.681 to 0.943), and the area under the MSH2 ROC curve was 0.598 (95% CI 0.418 to 0.777).
Conclusions Despite the advantage of QD staining to enable several markers to be measured simultaneously, it is of lower utility than DAB IHC for the identification of MMR mutation carriers. Automated DAB IHC staining and quantitative slide analysis may enable high-throughput IHC.
- Lynch syndrome
- Hereditary nonpolyposis colorectal cancer
- immunohistochemistry
- DNA mismatch repair
- Biological markers
- Evaluation studies
- quantum dot
- cancer genetics
- colorectal cancer
- immunohistochemistry
- quantitation
Statistics from Altmetric.com
- Lynch syndrome
- Hereditary nonpolyposis colorectal cancer
- immunohistochemistry
- DNA mismatch repair
- Biological markers
- Evaluation studies
- quantum dot
- cancer genetics
- colorectal cancer
- immunohistochemistry
- quantitation
Introduction
Lynch Syndrome is an autosomal dominant cancer predisposition syndrome caused by mutations in DNA mismatch repair (MMR) genes, MLH1, MSH2, MSH6 and PMS2.1 Despite an increased cancer risk, individuals with Lynch Syndrome lack clear phenotypic characteristics. Mutation carrier identification is desirable as screening reduces mortality.2 Immunohistochemistry (IHC) of the MMR proteins has great potential as a method of identifying the most likely mutation and guiding mutation analysis. However, IHC of the MMR proteins is not yet well established, and problems have been reported with staining and slide interpretation.3 It has been recommended that assessment of IHC staining of the MMR proteins is performed on a semiquantitative basis.4 Despite this, analysis of the majority of the current literature reveals qualitative slide assessment methods.5–16
A semiquantitative approach to IHC slide assessment in Lynch Syndrome has been utilised by three studies4 11 17 and has been found to be highly sensitive and specific.17 There are benefits to quantitative imaging methods: they outperform human observers in terms of precision and reproducibility,18–20 and imaging software permits full automation of slide analysis.
Quantitative immunohistochemistry has been described with red–green–blue (RGB) and multispectral imaging systems. RGB systems cannot easily resolve mixtures of different chromogens with overlapping spectral profiles.18 21 Spectral imaging combines spectroscopy and imaging. Image-analysis software reconstructs an image cube containing spectral information for every pixel of that image. Through the prior measurement of the wavelength emission spectra for each chromogen or fluorochrome, the quantity of chromogen or fluorochrome at each pixel can be calculated.22 This enables accurate differentiation and quantification of signals from multiplexed markers.21 Spectral unmixing algorithms rely on the signals adding together in a linear manner. This is true with fluorescent dyes, but not with chromogens as they absorb light,18 though conversion to optical density (OD) units restores linearity.18 21
A number of studies have utilised image-analysis techniques in the quantification of IHC staining in colorectal cancers. These are summarised in table 1.
Quantititative immunohistochemistry (IHC) in colorectal cancer (CRC): previous reports
Semiconductor quantum dots (QDs) are fluorescent markers that possess a high fluorescence efficiency, lack of photobleaching and long fluorescence lifetime. Their fluorescent activity is quantifiable, and the emission wavelength is sharp, permitting multiple staining.26 27 These advantages of QDs have rendered them successful reporter molecules in immunofluorescent staining, particularly in combination with spectral imaging and in formalin-fixed paraffin-embedded (FFPE) samples.28–30 Their multiplex capabilities have been demonstrated in a number of studies,28–33 with up to five molecular markers simultaneously identified.30 One study has used QD IHC in colorectal cancer, reporting successful multiplexing of six unspecified ‘biomarkers of risk.’32
The aim of this study is to compare two novel methodologies: quantitative 3,3′-diaminobenzidine (DAB) IHC, and quantitative QD IHC in the identification of MMR mutation carriers.
Methods
All participants were referred to the Clinical Genetics Department at St Mary's Hospital between 1989 and 2007 on the basis of clinical criteria or known familial mutation. They had undergone genetic counselling and, as appropriate, microsatellite testing. Suitable patients underwent sequencing of all relevant exons of the MMR genes. Mutations were assessed for pathogenicity against the InSiGHT database (http://www.insight-group.org) and recent literature. Families with proven MMR mutations were entered on the North West Regional Genetics Lynch Syndrome Database prospectively. Ethical approval was obtained for their recruitment to the study (project reference 07/Q1404/64).
Patients with confirmed germline mutation in one of the mismatch repair genes: MLH1, MSH2, MSH6 and previous histologically proven colorectal cancer were identified through the North West Regional Genetics Lynch Syndrome Database. The control cases were consecutive unselected patients over the age of 60 with histologically proven left-sided colon or rectal cancer.
Archived formalin-fixed, paraffin-embedded (FFPE) tumour blocks were retrieved and anonymised. Diagnosis was confirmed after a review of pathology reports and H&E slides.
Four-micrometer sections were mounted on coated slides followed by antigen retrieval using pressure heating in 0.001 M EDTA (pH 8.0) at 1 bar for 6 min. The slides were then stained by the two different methods.
DAB IHC staining methodology
DAB IHC staining for the MMR proteins was performed on an automated platform as previously described.17
Multiplex QD IHC staining methodology
Triplex staining for MLH1, MSH2 and smooth muscle actin (SMA) was performed by sequential incubation cycles of blocking, primary antibody incubation, secondary antibody incubation and QD incubation; SMA was used to facilitate architectural assessment. For each cycle, sections were blocked for 20 min with 10% (v/v) normal goat serum (Vector Laboratories, Peterborough, UK) in TBS; washed in TBS wash and then blocked with avidin (Avidin/Biotin Blocking Kit, Vector Laboratories) for 15 min in Avidin; followed by a TBS wash; prior to block for 15 min in biotin (Avidin/Biotin Blocking Kit, Vector Laboratories). They were then incubated with a mouse antihuman primary antibody diluted in 10% goat serum; MHL1 (product code NCL-L-MLH1, Novocastra Laboratories, Newcastle, UK) was diluted 1:100 (v/v), MSH2 (product code 182 343; Invitrogen, Paisley, UK) 1:250 and SMA (product code M0851; Dako, Ely, UK) 1:150. They were then washed in TBS and incubated with biotinylated goat antimouse IgG (product code BA-9200, Vector Laboratories) diluted 1:150 (v/v) in 10% goat serum, followed by a TBS wash prior to incubation with streptavidin-coated Qdots (Invitrogen) diluted 1:100 (v/v) in 10% (v/v) goat serum; MHL1, MSH2 and SMA were disclosed with 625 nm, 655 nm and 605 nm QDs respectively.
Following triplex staining, sections were mounted with Polyvinyl Alcohol Mounting Medium with Dabco, Antifading (Sigma-Aldrich Company, Gillingham, UK); and sealed with nail varnish.
Imaging, analysis and quantitation
The multiplexed QD IHC slides, and the standard DAB stained IHC slides, were then analysed with a spectral imaging system in both the fluorescence and bright-field modes.
The imaging-analysis system comprised a Leitz Diaplan fluorescence microscope (Leitz, Germany) and a CRI Nuance spectral analyser (Cambridge Research and Instrumentation, Woburn, Massachusetts). In the fluorescence setting, a 490 nm long pass excitation filter was used. The system was controlled by a Dell Pentium 4 processor (Dell, Round Rock, Texas), and the image acquisition and analysis were performed with Nuance 2.6.0 (Cambridge Research and Instrumentation, Woburn, Massachusetts).
Two spectral libraries were created. For bright-field analysis, the spectral library contained spectral profiles for DAB and haematoxylin. For fluorescence analysis, the library contained spectral profiles for each wavelength QD (605 nm, 625 nm, 655 nm) and autofluorescence.
Bright field was used to image the DAB-stained slides, with identification of areas of normal and tumour tissue from parallel H&E-stained slides followed by image capture from 420 nm to 720 nm in 20 nm wavelength steps at 25× magnification of the same areas on the DAB-stained slide. Image cubes were taken of one normal and three random areas of tumour tissue, and the spectral data automatically converted to optical density (OD) units by taking the negative log of the transmitted image divided by the illumination.18 21
Fluorescent images were captured at 40× magnification from 500 nm to 720 nm in 10 nm wavelength steps. Image cubes were taken of one normal and three random areas of tumour tissue.
Analysis of spectral data
The Nuance software was used to calculate the relative contribution to total signal intensity of each of the reference spectra at each pixel31 from which greyscale intensity maps of the separate QD or DAB signals proportional to the quantity of antigen were produced. From these, the average signal for each marker in a region of interest (ROI) was measured. Scores were calculated for the mean value for three random tumour areas for each antibody stain.
Using SPSS 13.0, the quantitative intensity scores for each antibody stain were analysed, and receiver operating characteristic (ROC) curves of the staining performance of each specific DAB or QD antibody stain for the identification of mutation carriers derived. The sensitivity and specificity of each antibody stain for the identification of mutation carriers were plotted. The area under each ROC curve representing diagnostic accuracy34 was calculated using a non-parametric approach, and optimum cut-offs were calculated, which maximised the sum of sensitivity and specificity.
Results
In total, tumour sections from 36 mutation carriers (34 pathogenic, two unclassified variants) and six controls were obtained. Of the 34 pathogenic mutation carriers, there were 19 MLH1 mutation carriers and 15 MSH2 mutation carriers. Of the two carriers of unclassified variant mutations, there was one MSH2 carrier and one MSH6 carrier.
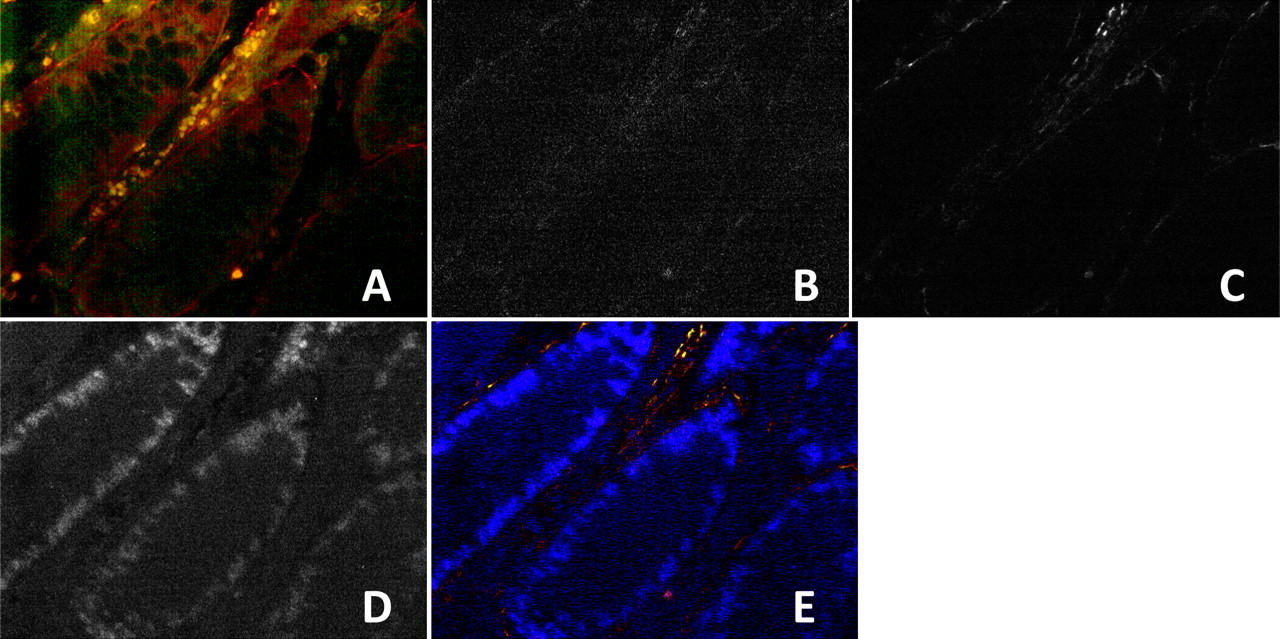
Triplex QD IHC for MLH1, MSH2 and SMA was successfully performed in each of the cases analysed. Figures 1 2 illustrate representative images from sections of normal colonic mucosa and tumour respectively from an MHL1 mutation carrier stained with QDs conjugated to antibodies against MLH1, MSH2 and SMA. Intensity maps for the different QDs/antibodies are shown in grey scale. Both MLH1 and MSH2 are positive in the normal tissue (figure 1), while in the tumour section (figure 2), MSH2 is positive and MLH1 negative, concordant with MLH1 mutation carrier status. Representative bright-field images of the same tumour are shown in figures 3–5 demonstrating positivity for MLH1 in normal tissue (figure 3) but absence of MLH1 in tumour (figure 4), though the tumour retained strong nuclear positivity for MSH2 (figure 5).
Fluorescent images of normal colonic mucosa from MLH1 mutation carrier stained with quantum dots (QDs) conjugated to mismatch repair antibodies. (A) Normal colonic mucosa stained with MLH1/625 QD, MSH2/655 QD and SMA/605 QD at 40× magnification. (B) Intensity map of 625 QD conjugated to MLH1. (C) Intensity map of 605 QD conjugated to smooth muscle actin. (D) Intensity map of 655 QD conjugated to MSH2. (E) Composite false-colour image.

Fluorescent images of tumour from MLH1 mutation carrier stained with quantum dots (QDs) conjugated to mismatch repair antibodies. (A) Tumour stained with MLH1/625 QD, MSH2/655 QD and smooth muscle actin (SMA)/605 QD at 40× magnification. (B) Intensity map of 625 QD conjugated to MLH1. (C) Intensity map of 605 QD conjugated to SMA. (D) Intensity map of 655 QD conjugated to MSH2. (E) Composite false-colour image.

Bright-field images of normal colonic mucosa from MLH1 mutation carrier stained with MLH1 antibody conjugated to 3,3′-diaminobenzidine (DAB). (A) Normal colonic mucosa stained with MLH1 antibody conjugated to DAB chromogen and haematoxylin counterstain at 25× magnification. (B) Intensity map of DAB conjugated to MLH1. (C) Intensity map of haematoxylin. (D) Composite false-colour image.

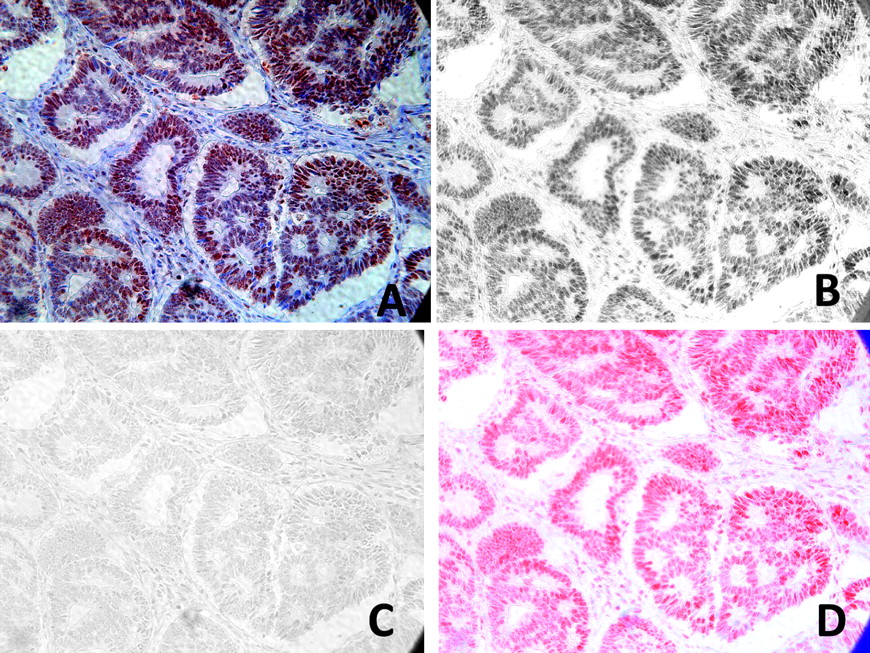
Bright-field images of tumour from MLH1 mutation carrier stained with MLH1 antibody conjugated to 3,3′-diaminobenzidine (DAB). (A) Tumour from an MLH1 mutation carrier stained with MLH1 antibody conjugated to DAB chromogen and haematoxylin counterstain at 25× magnification. (B) Intensity map of DAB conjugated to MLH1. (C) Intensity map of haematoxylin. (D) Composite false-colour image.

Bright-field images of tumour from MLH1 mutation carrier stained with MSH2 antibody conjugated to 3,3′-diaminobenzidine (DAB). (A) Tumour from an MLH1 mutation carrier stained with MSH2 antibody conjugated to DAB chromogen and haematoxylin counterstain at 25× magnification. (B) Intensity map of DAB conjugated to MSH2. (C) Intensity map of haematoxylin. (D) Composite false-colour image.
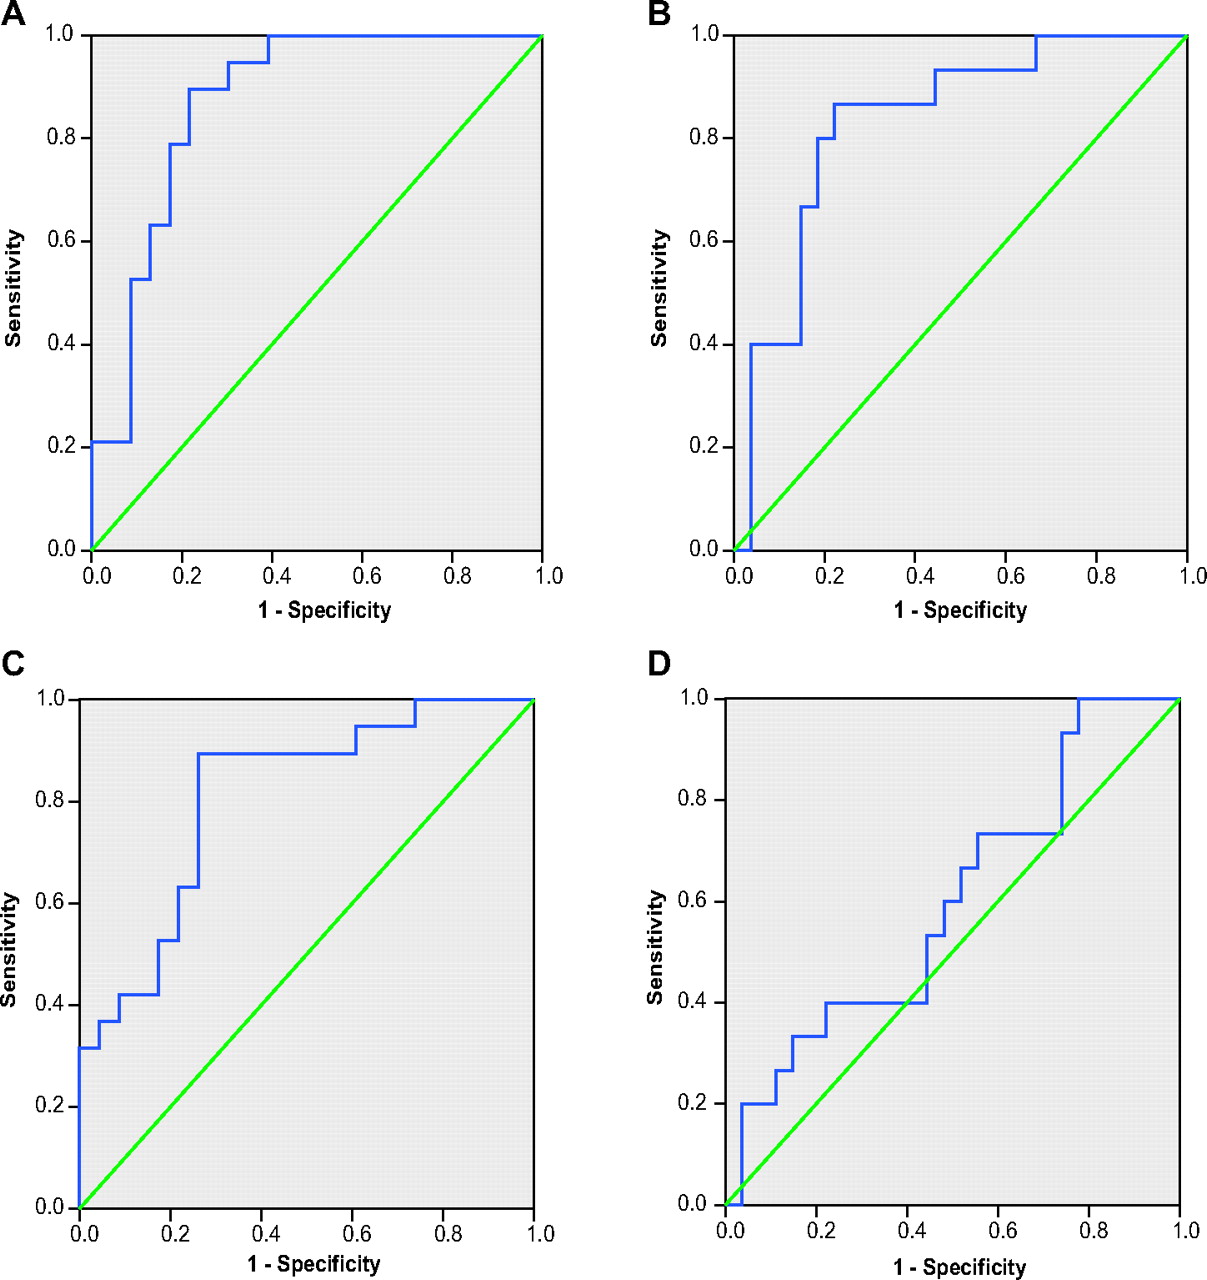
ROC curves (figure 6) are shown for the mean tumour scores for: (A) performance of MLH1 DAB IHC for identifying MLH1 mutation carriers; (B) performance of MSH2 DAB IHC for identifying MSH2 mutation carriers; (C) performance of MLH1 QD IHC for identifying MLH1 mutation carriers; and (D) performance of MSH2 QD IHC for identifying MSH2 mutation carriers. The area under the ROC curve (equivalent to the performance of the test) is the greatest for quantitative MLH1 DAB IHC. MSH2 DAB IHC and MLH1 QD IHC are both moderately informative for the identification of mutation carriers, though MSH2 QD IHC is almost completely uninformative. Overall, quantitative DAB IHC performs better than quantitative QD IHC.

Receiver operating characteristic (ROC) curves of performance of mean tumour scores of quantum dot and immunohistochemistry (IHC) staining for the identification of mutation carriers. (A) ROC curve: performance of quantitative MLH1 3,3′-diaminobenzidine IHC for the identification of MLH1 mutation carriers. Area under ROC curve 0.872 (95% CI 0.763 to 0.981). (B) ROC curve: performance of quantitative MSH2 3,3′-diaminobenzidine IHC for the identification of MSH2 mutation carriers. Area under ROC curve 0.832 (95% CI 0.704 to 0.960). (C) ROC Curve: Performance of quantitative MLH1 QD IHC for the identification of MLH1 mutation carriers. Area under ROC Curve 0.812 (95% CI 0.681 to 0.943). (D) ROC Curve: Performance of quantitative MSH2 QD IHC for the identification of MSH2 mutation carriers. Area under ROC Curve 0.598 (95% CI 0.418 to 0.777).
At the optimum cut-offs, MLH1 DAB IHC has a sensitivity of 0.895 (95% CI 0.669 to 0.987) and a specificity of 0.783 (95% CI 0.563 to 0.925). MSH2 DAB IHC has a sensitivity of 0.867 (95% CI 0.595 to 0.983) and a specificity of 0.778 (95% CI 0.577 to 0.914).
Conclusions
This comparative study has investigated the utility of two novel methodologies, quantitative 3,3′-diaminobenzidine (DAB) IHC, and quantitative QD IHC, for detection of MMR gene mutation status in colorectal cancers from a large cohort of 34 pathogenic MMR mutation carriers. Both DAB IHC and QD IHC were able to identify MMR gene mutation, but ROC analysis demonstrated a greater sensitivity and specificity of quantitative DAB IHC.
QDs have sharp emission spectra, permitting multiplex staining, while the linear relationship between antigen quantity and QD signal intensity facilitates signal quantitation, and these properties were expected to result in their superior performance compared with DAB IHC. Conversely, since DAB scatters rather than absorbs light resulting in a non-linear relationship between DAB signal intensity and amount of antigen bound, quantitation of MMR proteins would be expected to be inferior with this method. In practice, however, quantitation of DAB IHC staining was more sensitive and specific for the identification of MMR mutation carriers than QD IHC staining, while other studies have also shown DAB signal intensity to correlate well with other techniques of antigen quantitation.20 23 24
QD staining was inferior, particularly for MSH2. This may be due to variability in manually conducted staining, and the effect of using FFPE blocks of differing ages, whereas DAB staining on an automated platform would have less staining heterogeneity. Furthermore, there were practical difficulties in fluorescence imaging due to lower signal strength and tissue autofluorescence, which were compounded by a relative difficulty in identifying regions for analysis in the fluorescent images, which was partially though not completely overcome by the use of SMA to highlight tissue architecture; these factors may not be as critical in other studies that have used QD IHC. The relative advantages of DAB and QD staining are summarised in table 2.
Advantages and disadvantages of 3,3′-diaminobenzidine and quantum dot quantitative immunohistochemistry
Quantitative analysis compares well to semiquantitative analysis as previously performed by this study group. For semiquantitative DAB IHC, the area under the MLH1 ROC curve was 0.981 (95% CI 0.952 to 1.000), and the area under the MSH2 ROC curve was 0.899 (95% CI 0.796 to 1.000).17 This compares to quantitative DAB IHC in this study, where the area under the MLH1 ROC curve was 0.872 (95% CI 0.763 to 0.981), and the area under the MSH2 ROC curve was 0.832 (95% CI 0.704 to 0.960).
For IHC to be used safely as a prescreen for mutation analysis in patients suspected of harbouring a MMR mutation, a sensitivity of >86% is required.3 In this cohort of patients, quantitative DAB IHC staining with MSH1 and MSH2 antibodies meets this requirement at the optimum cut-offs (although the lower 95% CI falls below this value). While quantitative IHC is marginally inferior to semiquantitative methods, the potential for automation is a great advantage. The development of automated DAB IHC staining and quantitative multispectral slide analysis may enable future high-throughput IHC for MMR mutation carrier screening, requirement for which is likely to increase with increasing recognition of the importance of the therapeutic consequences of MMR gene mutation in Lynch Syndrome.
Take-home messages
While QD immunofluorescent staining has the advantage of measuring multiple markers, in this study it was of lower utility than DAB IHC for the identification of MMR mutation carriers.
Quantitative DAB IHC compared well to established semiquantitative methods.
With development, automated DAB IHC staining and quantitative slide analysis may enable high-throughput IHC.
References
Footnotes
Funding Work supported in part by grants from the Bowel Disease Research Foundation and Central Manchester and Manchester Children's University Hospitals NHS Trust Research Grant Scheme. This study group is supported by the NIHR Manchester Biomedical Research Centre.
Competing interests None.
Ethics approval Ethics approval was provided by the Salford and Trafford Research Ethics Committee, project reference 07/Q1404/64.
Provenance and peer review Not commissioned; externally peer reviewed.