Article Text

Abstract
Aims We hypothesised that CD1d expression in renal cell carcinoma (RCC) may play a role in modifying the host immune response. Our aims were to investigate the expression of CD1d and to correlate this with histopathology and clinical outcomes in a cohort study of patients with RCC.
Methods Gene expression and tissue microarray studies on a panel of RCC tissue were performed. Clinicopathological correlation was analysed using χ2/Fisher's exact test. Relapse-free survival, cancer-specific survival and overall survival were calculated for both CD1d high and low expressors. Survival outcomes were estimated with the Kaplan–Meier method and compared using Cox regression analysis.
Results Gene expression microarray showed significant expression of CD1d in RCC versus normal renal tissue. By immunohistochemistry, we found that CD1d expression significantly associated with tumour stage/grade, higher relapse rates, poorer cancer-specific and overall survival.
Conclusions CD1d expression on RCC correlated with aggressive disease and poorer clinical outcomes.
- IMMUNOHISTOCHEMISTRY
- IMMUNOLOGY
- UROPATHOLOGY
This is an Open Access article distributed in accordance with the Creative Commons Attribution Non Commercial (CC BY-NC 4.0) license, which permits others to distribute, remix, adapt, build upon this work non-commercially, and license their derivative works on different terms, provided the original work is properly cited and the use is non-commercial. See: http://creativecommons.org/licenses/by-nc/4.0/
Statistics from Altmetric.com
Introduction
There is ample evidence that renal cell carcinoma (RCC) is an immunogenic tumour. Rare spontaneous remission of metastatic RCC has been attributed to an immune response,1 and high-dose interleukin 2 remains an effective immunotherapy with durable clinical responses.2 Notwithstanding, the path to successful immunotherapy for RCC is paved with many obstacles. Besides the presence of inhibitory cells such as regulatory T cells (Tregs) and myeloid-derived suppressor cells (MDSCs), there are tumour-associated molecules that directly suppress the host immune response. B7-H1 (PD-L1) has been demonstrated to independently predict patients with RCC at risk for progression.3 A phase I trial using anti-PD-L1 antibody therapy has demonstrated objective responses in patients with RCC.4 B7-H3 and H4 have also been shown to be associated with aggressive tumour behaviour in RCC.5 ,6 Glycolipids are yet another class of molecules expressed by RCC that have long been associated with worse clinical outcomes.7 Das et al8 described the synergy between tumour-derived tumour necrosis factor α and RCC-associated ganglioside GM1 in inducing T-cell apoptosis. Shedding of other tumour-associated gangliosides, GM2, GD2 and GD3, have also been linked with immune dysfunction in RCC.9 ,10 Another ganglioside DSGb5 was shown to inhibit natural killer (NK) cell cytotoxicity against RCC via inhibitory receptor Siglec-7.11
CD1d are non-polymorphic major histocompatibility (MHC)-like molecules that are mainly expressed by antigen-presenting cells (APC) including monocytes, macrophages, dendritic cells (DCs) and B cells. CD1d molecules present glycolipids to NKT cells that express both the NK cell marker CD161 and a T-cell receptor (TCR). NKT cells play a pivotal role at the interface between the innate and adaptive immune response. The largest group of NKT cells (invariant or iNKT) express the semi-invariant TCR Vα24-Jα18 paired with Vβ11 and display antitumour immune responses when activated by the synthetic glycosphingolipid, α-galactosylceramide (αGalCer).12 Diverse NKT cells are non-reactive to αGalCer and have been found to suppress anti-tumour activity in animal models. CD1d expression has been demonstrated in human cancers,13–15 and pulsing of CD1d-positive tumour cells with αGalCer rendered them sensitive to direct NKT cell killing.16 Conversely, in ovarian cancer-associated ascites, the presence of GD3 inhibited αGalCer-induced NKT cell activation.17
The abundance of glycolipids contributing to the ‘clear cell’ histology of RCC (the large majority of RCC) led us to hypothesise that endogenous lipid antigens presented on CD1d in RCC may play an important role in modulating the host immune response. Our objectives were to study CD1d expression in RCC tissue and to correlate this with histopathological features and clinical outcomes.
Materials and methods
Gene expression microarray
Publicly available Affymetrix GeneChip Human Genome U133 Plus 2.0 microarray data from 138 clear cell RCC samples and 22 normal kidney tissue samples were downloaded from the Gene Expression Omnibus (http://www.ncbi.nlm.nih.gov/geo, accession ID: GSE17895) and processed using the R statistical software (http://www.r-project.org) and open-source BioConductor (http://www.bioconductor.org) packages. Differential expression of genes between normal kidney and RCC samples was analysed using an empirical Bayes moderated t test provided by the limma package. Genes were considered differential expressed if upregulated or downregulated more than twofold with a Benjamini–Hochberg false-discovery rate <0.05. Genes involved in immune response were annotated by obtaining genes associated with the IMMUNE_RESPONSE GO (Gene Ontology) term. A heatmap of mean-subtracted values for these genes, ordered by log fold change, was then generated using the PGSEA package, whereas the bee swarm plot showing expression values for CD1d was generated using the beeswarm package.
Tissue microarray construction and immunohistochemistry
This retrospective cohort study comprised 323 RCC consecutive cases diagnosed at the Department of Pathology, Singapore General Hospital. Following institutional review board approval, the histological slides were retrieved and whole sections reviewed. Representative tumour-bearing areas were selected and tissue microarrays were constructed using Beecher Microarrayer with 1 mm cores, two cores per case.
Immunohistochemistry was performed on sections cut from tissue microarray constructions (TMAs). The sections were stained with primary mouse anti-human CD1d monoclonal antibody (NOR3.2 Santa Cruz Biotechnology) and immunoglobulin G1 isotype control using the mouse monoclonal antibody to thyroid transcription factor-1 (Novocastra, Leica biosystems). The sections (4 µm) were cut from TMA blocks and mounted on Leica Microsystems Plus slides and dried on heating bench for 20 min. Staining procedure was performed using the Leica Bond Autostainer (Leica Biosystem, Newcastle, UK). The slides were placed on the Bond trays and covered with covertiles. The trays containing the slides were loaded into the system. The sections were deparaffinised and pretreated using bond dewax reagents and ER2 antigen retrieval buffer of pH 8.9–9.1. Endogenous peroxidase activity was blocked using hydrogen peroxide for 5 min followed by primary antibody incubation for 20 min. The sections were then treated with postprimary and polymer reagents followed by mixed 3.3’- diaminobenzidine refine reagent. The detection system used was Bond polymer refine detection (DS9800). The sections were counterstained with haematoxylin and the slides were unloaded from the system and then dehydrated and mounted in depex.
The staining intensity and percentage of CD1d positive tumour cells were recorded. The immunoreactive score was calculated as: (3×% strong staining)+(2×% moderate staining)+(1×% weak staining), with high biomarker expression defined as an immunoreactive score of ≥50.
Database
Clinical data were extracted from the Department of Urology, Singapore General Hospital Urological Cancer Registry, Business Intelligence Enterprise Edition (Oracle Business Intelligence Enterprise Edition).
Statistical analysis
Comparison of CD1d expression with pathological features was evaluated using the χ2/Fisher's exact test. Relapse-free survival, cancer-specific survival and overall survival were calculated for both CD1d high and low expressors. Survival outcomes were estimated with the Kaplan–Meier method and compared using Cox regression analysis. OR was calculated with 95% CIs. Data were further adjusted for the Mayo clinic SSIGN score (stage, size, grade and necrosis). Statistical significance was taken at p<0.05. Software for statistical analyses was SPSS V.17.0.
Results
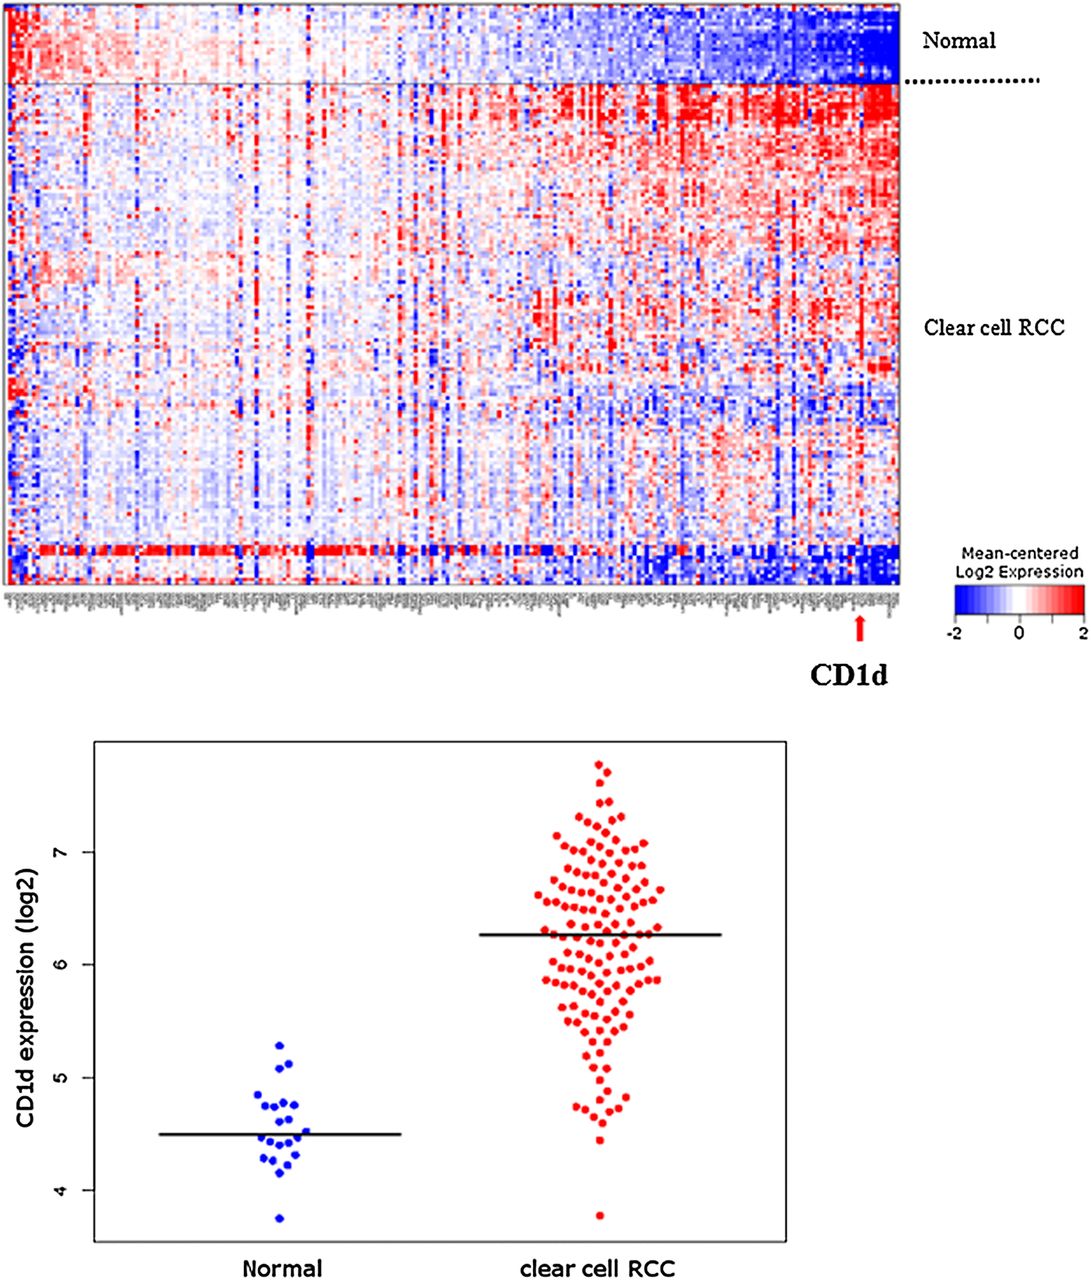
We examined the expression of CD1d in a gene expression microarray of 138 clear cell RCC compared with 22 normal renal tissue from a publicly available database, looking particularly at genes associated with immune responses. Figure 1 shows the heatmap generated with the CD1d gene highlighted by the red arrow. Gene expression microarray studies showed significant upregulation of CD1d in clear cell RCC compared with normal tissue. The upregulation was highly significant with a false-discovery rate of 1.47E−16.

Heatmap of immune-response gene expression in 138 primary clear cell renal cell carcinoma (RCC) tumours versus 22 normal renal tissue (above). Red colour indicates a relative increase in gene expression, whereas blue indicates decreased expression. CD1d gene is indicated by a red arrow. Beeswarm plot of CD1d expression in clear cell RCC versus normal renal tissue (below). Median is indicated by black horizontal line. Expression values have been log2-transformed, such that a log2 difference of 2 is equivalent to a fourfold increase in expression.
We then examined the expression of CD1d in various tissues including normal and malignant renal histology. Tonsillar tissue was used as positive control. Figure 2A shows positive stain of CD1d on lymphocytes and APC in the mantle zones with notable absence within the germinal centres of the tonsil. Expression of CD1d is seen in tubules within normal renal epithelium in figure 2B. Figure 2C, D shows the expression of CD1d in low-grade and high-grade clear cell RCC, respectively. There was minimal CD1d stain in low-grade disease, with extensive staining seen in high-grade disease.
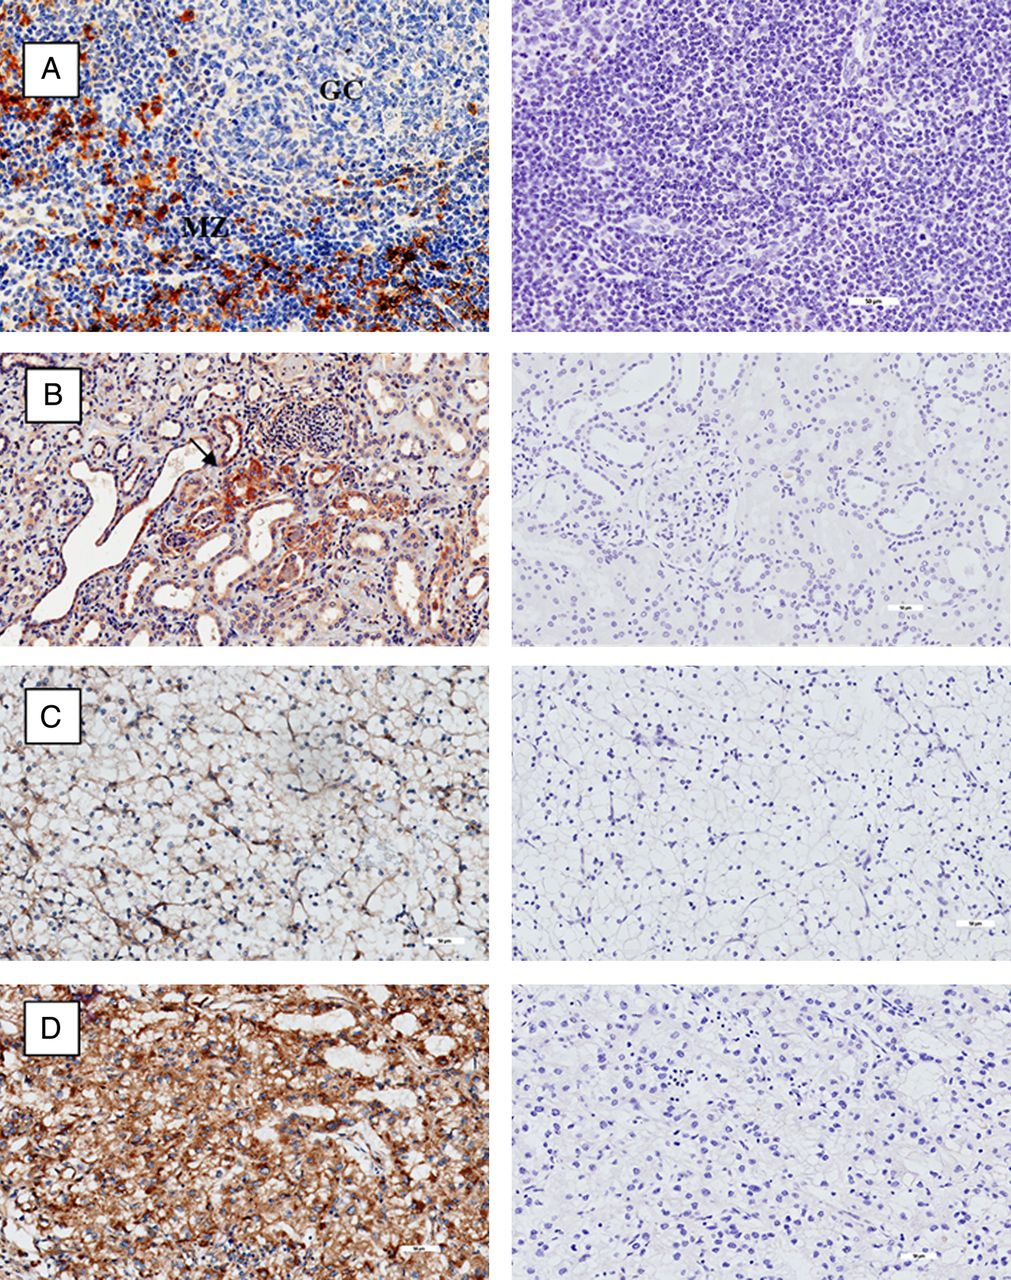
Immunohistochemistry of CD1d (stained brown) on left column, with isotype controls on corresponding tissue on right column. (A) Tonsil with mantle zone and germinal centre labelled accordingly. (B) Normal renal tissue. Isolated tubular cells positive for CD1d labelled with black arrow. (C) Low-grade clear cell renal cell carcinoma (RCC). (D) High-grade clear cell RCC. All magnifications at ×20.
We looked at RCC tissue from patients for whom a nephrectomy was performed with curative intent (ie, excluding palliative or cytoreductive nephrectomy). A tissue array of 323 resected RCC tumours was constructed and stained for CD1d. Exclusion of 52 cases was made based on incompleteness of clinical data (n=17), presence of metastases at the time of surgery (n=31) or unclear pathological grading (n=4). Final analysis was performed on 271 cases. Two hundred and forty-eight cases (91.5%) were of clear cell pathology, with the majority of remainder being of the papillary type. Specimens were segregated according to the immunoreactivity score of low (<50) or high (≥50) expression of CD1d and correlated with clinicopathological features.
Table 1 shows that CD1d high expressors were significantly associated with tumour stage (American Joint Committee on Cancer 2002 classification), tumour grade, presence of sarcomatoid change (p=0.04) and lymphovascular invasion (p=0.048), the latter two features well known to be associated with aggressive disease. There was CD1d expression found in both clear cell and papillary pathologies, but the numbers were too few to discern any significant differences in CD1d expression between histological types.
Clinical and pathological features by CD1d immunoreactivity score
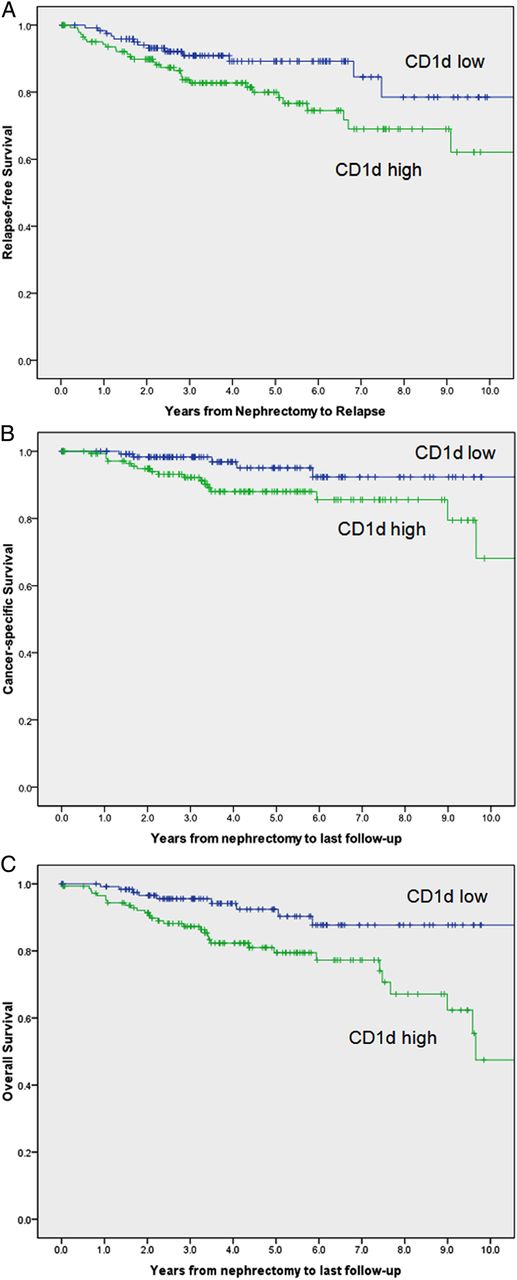
At last follow-up, 41 of the 271 patients studied had died, including 22 patients who died from RCC at a median of 2.5 years after surgery (range 0.6–9.7 years). Among the 230 patients remaining (85%), the median duration of follow-up was 4 years (range 0–12.9 years). Figure 3A shows the relapse-free survival, figure 3B shows the cancer-specific survival and figure 3C the overall survival between CD1d high and low expressors. There was a significant difference in survival between low and high expressors (OR 1.997 (1.041 to 3.830), p=0.037; OR 2.819 (1.038 to 7.654), p=0.042; OR 2.849 (1.355 to 5.990) p=0.006, respectively). Because tumour stage and grade were strongly associated with CD1d expression, we sought to determine whether CD1d expression was an independent predictor of survival. After further stratification using the SSIGN score for RCC tumour SSIGN (Mayo clinic), the data showed the same trend but did not attain statistical significance (OR 1.191 (0.602 to 2.356), p=0.616; OR 1.735 (0.613 to 4.911), p=0.299; OR 1.982 (0.921 to 4.265), p=0.08, respectively).
(A) Relapse-free survival of CD1d low and high expressors from 271 patients with renal cell carcinoma (RCC). Unadjusted OR was 1.997 (1.041 to 3.830), p=0.037. After adjustment for the Mayo Clinic SSIGN (stage, size, grade and necrosis) score, OR was 1.191 (0.602 to 2.356), p=0.616. (B) Cancer-specific survival of CD1d low and high expressors from 271 patients with RCC. Unadjusted OR was 2.819 (1.038 to 7.654), p=0.042. After adjustment for the Mayo Clinic SSIGN score, OR was 1.735 (0.613 to 4.911), p=0.299. (C) Overall survival of CD1d low and high expressors from 271 patients with RCC. Unadjusted OR was 2.849 (1.355 to 5.990), p=0.006. After adjustment for the Mayo Clinic SSIGN score, OR was 1.982 (0.921 to 4.265), p=0.08.
Discussion
Unlike classical MHC molecules, CD1d does not map to the human leucocyte antigen locus on chromosome 6 and displays restricted tissue distribution. Canchis et al18 examined the tissue distribution of CD1d in a variety of tissues. Apart from lymphatic tissue of the thymus and extrathymic cells of haematopoietic lineage, CD1d expression was described in the gastrointestinal tract, breast, skin and kidneys, with preferential expression in epithelial cells, vascular smooth muscle and some parenchymal cells in the liver and pancreas. In normal kidney tissue, expression was confined to the tubules and muscular components of the blood vessels, similar to our findings. The majority of non-haematological solid tumours are CD1d negative, and no study to our knowledge has studied CD1d expression in RCC. The presence of CD1d has been correlated with an increased antitumour response. CD1d-positive gliomas are susceptible to ex vivo-activated NKT cell killing.19 CD1d was shown to be stage specific in myelomonocytic leukaemias and could provide a target for NKT cell-mediated immunotherapy.14 Our data suggest the contrary, in that the expression of CD1d in RCC was associated with a more aggressive phenotype, with higher relapse rates, poorer cancer-specific survival and overall survival. However, this was not an independent predictor of outcome when stratified by stage and grade.
CD1d can present endogenous and exogenous lipids to NKT cells, a heterogeneous group of readily activated immune cells that have the ability to skew the subsequent immune responses via massive cytokine release (Th1-like or Th2-like). NKT cells also interact with DCs, Tregs20 and MDSC.21 DC-based vaccines have been studied in phase I trials in RCC.22 Tregs are well-described inhibitors of immunity towards self-antigens and play a controversial inhibitory role in RCC immunity, with some studies correlating the presence of peripheral Tregs in patients with RCC with worse outcome,23 ,24 and others finding no relation with intratumoural Tregs.25 MDSCs have been associated with suppression of tumour immunity in RCC,26 and the removal of these suppressive cells has been proposed to be a mechanism of anti-tumour response by targeted therapies such as Sunitinib, in current use for metastatic RCC.27
Diverse NKT cells interacting with CD1d and endogenous lipid ligands expressed on RCC tumour cells could explain the adverse outcome seen in our data. We propose that the higher expression of CD1d on more aggressive RCC tumours tilts the balance towards immune suppression via a combination of suppressive cytokines (Th2-type) and immune cells (Tregs, MDSC) in the tumour micro-environment. We also hypothesise a therapeutic window of opportunity in harnessing the potent ability of iNKT cells to reverse immune suppression and augment antitumour immunity by judicious use of exogenous activating lipid ligands. We are currently exploring CD1d-expressing RCC pulsed ex vivo with αGalCer analogues as autologous tumour vaccines.
Our study was limited by its retrospective nature and comprised mainly RCC of the clear cell variety (91.5%). We are extending our efforts to non-clear cell types of RCC.
In conclusion, our data suggest that the expression of CD1d in RCC is associated with an aggressive tumour phenotype, higher relapse rates, poorer cancer-specific survival and overall survival.
Take home messages
-
CD1d expression is increased in renal cell carcinoma.
-
CD1d expression is associated with more aggressive disease and poorer clinical outcomes in patients with renal cell carcinoma.
-
The CD1d-natural killer T cell axis may be potentially exploited to modulate tumour immunity.
Acknowledgments
The authors would like to thank Dr Lucia Mori (Singapore Immunology Network, A*STAR, Singapore) for her expert advice in the preparation of the manuscript.
References
Footnotes
-
Contributors All authors are aware of and have agreed to this submission and have individually contributed to the work as described. Collection of samples: FYG and DAAT. Performed experiments: FYG, MYS and DAAT. Clinical data and statistical analyses: HHH and WKL. Writing of paper: TWC and FYG. Experimental design: TWC, BTT and PHT. Overall guarantor: TWC.
-
Funding This work was not specifically funded, but was carried out within the facilities of the Singapore General Hospital and National Cancer Centre, Singapore with Institutional Research Board approval.
-
Competing interests None.
-
Ethics approval Institutional Review Board, Singhealth.
-
Provenance and peer review Not commissioned; internally peer reviewed.
Linked Articles
- Correction