Article Text

Abstract
Aims Tumour microvessel density (MVD) is assessed by counting vessels in the most vascularised tumour region, the vascular hot spot. Current uncertainty regarding the prognostic role of MVD in breast cancer could, in part, be explained by variations in field area size for MVD assessment. We aimed to identify the field area size that provides the most accurate prognostic information in breast carcinoma.
Methods MVD was assessed in 212 tumours. von Willebrand factor positively stained vessels were counted in 10 consecutive visual fields in vascular hotspots. The 10 visual fields in the original counting sequence (MVD-Consecutive) were sorted from highest to lowest vessel count (MVD-Decreasing), and randomly (MVD-Random). After adding counts from one visual field at a time, mean MVD was calculated for each cumulative field area. The prognostic informativeness of each field area and sorting strategy were compared.
Results Median MVD decreased with increasing field size for MVD-Decreasing and MVD-Consecutive. A 0.35 mm2 total field area comprising only the highest vessel counts provided the most accurate prognostic information (MVD-Decreasing, HR for breast cancer death 1.06 per 10 vessels/mm2 increase, 95% CI 1.03 to 1.10). MVD-Decreasing gave more accurate prognostic information than MVD-Consecutive and MVD-Random, with decreasing prognostic informativeness with increasing field area.
Conclusions Median MVD and its prognostic informativeness decreased with increasing field area. Assessing MVD in a carefully selected small field area of 0.35 mm2 provides the most accurate prognostic information. This could facilitate the implementation of MVD assessment in breast cancer.
- breast cancer
- breast pathology
- blood vessels
- tumour biology
- immunohistochemistry
Statistics from Altmetric.com
Introduction
Tumour cells need access to vasculature to proliferate and metastasise.1 2 Microvessel density (MVD) is an acknowledged, frequently used method for measuring tumour-associated vasculature.3 In breast cancer (BC), high MVD has been associated with poor prognosis in some studies,3–10 but not in others.11–17 Methodological variations may contribute to lack of consistency across studies.
Since 1991, MVD has been used to quantify tumour vessels. Vessels are counted in tumour regions with the highest number of vessels, the ‘vascular hot spots’.3 8 However, there is no consensus regarding field area or total number of visual fields in which vessels should be counted. While some include one visual field,3 18 19 others include up to 10,5 10 13 15 17 and total field area varies from 0.19 mm2 3 to 6.8 mm2.20 Counting in larger field areas may reduce interobserver and intraobserver variation.21 However, larger areas may dilute the MVD value in a hot spot.5 22–24 One study comparing only two field areas suggested that the prognostic value of MVD was greater when counting in a smaller field area.5 There is a need for a systematic study of the effect of field area on prognostic accuracy in patients with BC.
BC can be classified into molecular subtypes using immunohistochemistry (IHC) and in situ hybridisation (ISH).25–29 We previously demonstrated that MVD is associated with prognosis in the luminal A, HER2 type and five negative phenotype (5NP), but not in the basal phenotype (BP).6 7 In this study, we sought to identify the field area size for MVD assessment that provides the most accurate prognostic information in 212 breast tumours from women with long-term follow-up.
Materials and methods
Study population and specimen characteristics
The main study population comprised 909 primary breast carcinomas from women who were born in 1886–1928,25 invited to participate in a survey for early BC detection in 1956–195930 31 and subsequently followed for BC occurrence from 1961 to 2008. Depending on which came first, patients were followed from diagnosis until death from BC, death from other causes or 31 December 2010. Data were linked to information from the Cancer Registry of Norway and the Cause of Death Registry of Norway.25
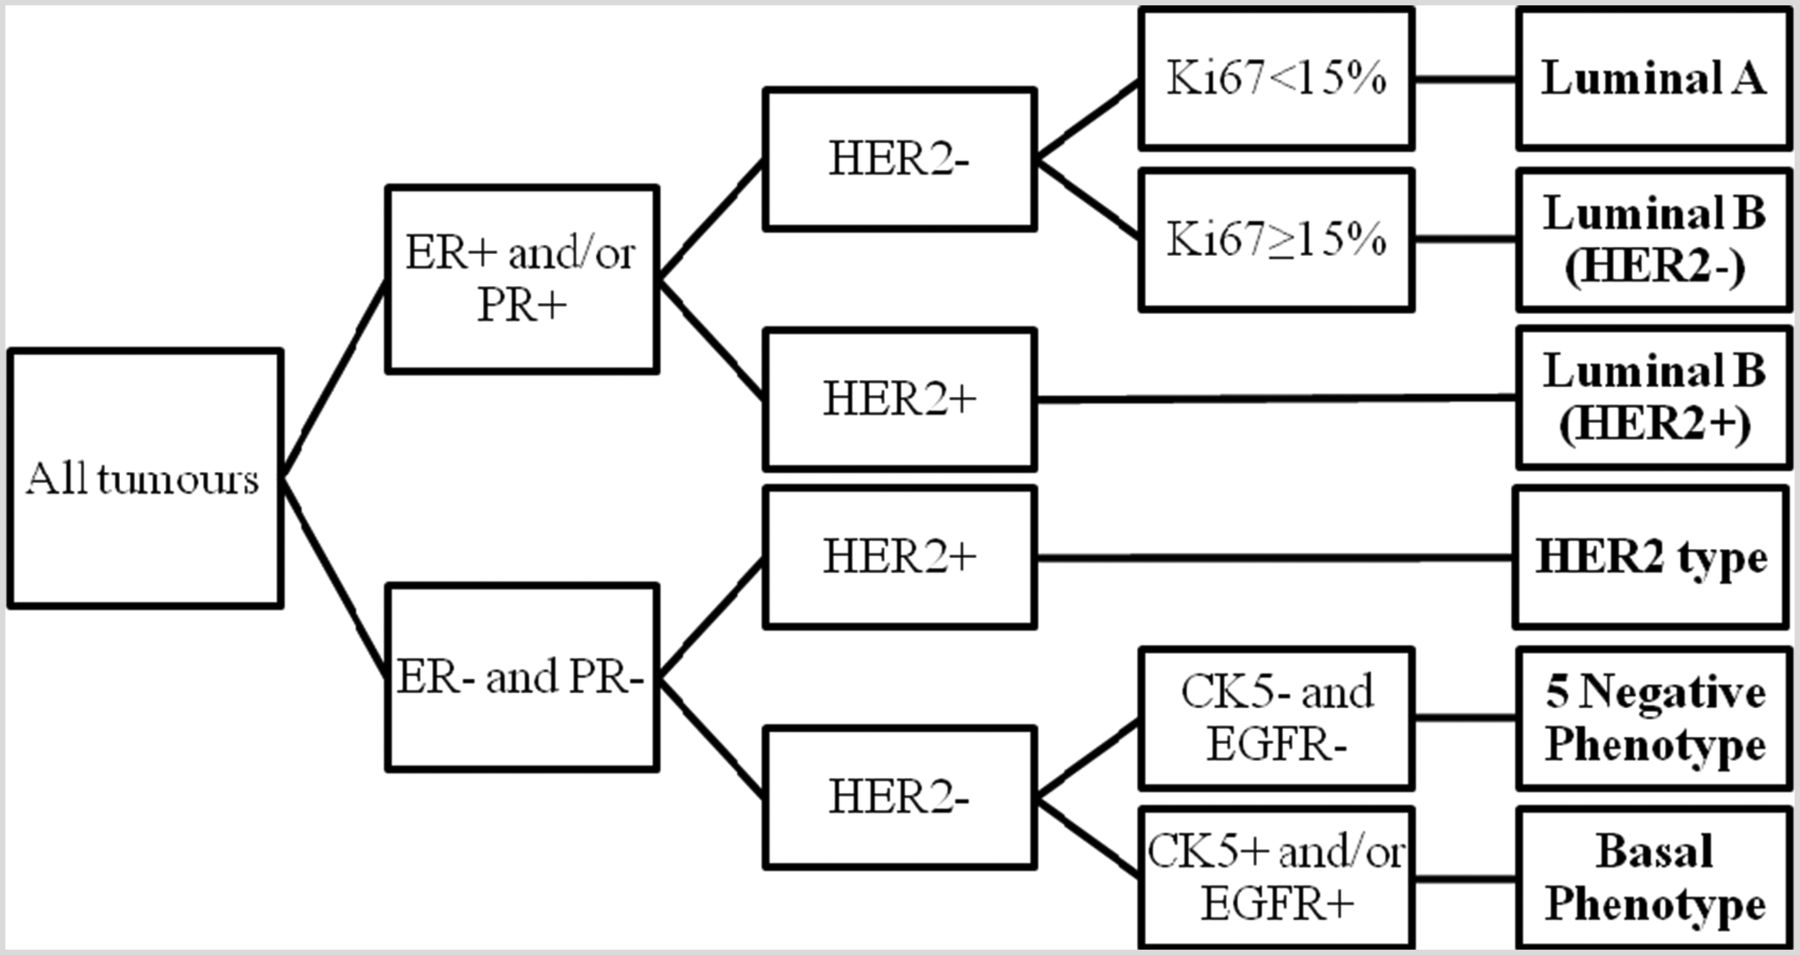
Pathology reports and formalin-fixed paraffin-embedded (FFPE) tissue had been retrieved from the Department of Pathology, St Olav’s Hospital, Trondheim University Hospital. As previously described,25 two pathologists independently reclassified tumours into histopathological type32 and grade.33 After tissue microarray construction, IHC and ISH were used to reclassify BCs into molecular subtypes (figure 1).25

Molecular subtyping algorithm. Luminal A, luminal B (HER2−), luminal B (HER2+), HER2 type, 5 negative phenotype, basal phenotype. CK5, cytokeratin 5; EGFR, epidermal growth factor receptor; ER, oestrogen receptor; HER2, human epidermal growth factor receptor 2; PR, progesterone receptor (adapted from Engstrøm et al, p. 466, figure 225).
From the main study population, the present study included all BC tumours (n=212) in which MVD had already been assessed by our group (figure 2)6 7: luminal A (n=63), BP (n=61), HER2 type (n=61) and 5NP (n=27). Vessel counting had been done on full-face sections in 10 consecutive visual fields (total field area 1.73 mm2) at ×400 magnification.6 7

Flow chart of the study population. Displays included cases, sorting strategies and calculations of microvessel density (MVD).
Immunohistochemistry
Dual-stain IHC for von Willebrand factor (vWF) and the proliferation marker Ki67 had been done previously.6 7 FFPE tumour tissue sections cut at 4 µm and stored at −20°C were heated at 42°C overnight. Heat-induced epitope retrieval was done in a pretreatment link with Dako Target Retrieval Solution buffer pH 6, S1699 (Dako). Initial temperature was 80°C, increasing to 97°C for 20 min before refrigeration. Dako Wash Buffer, S3006 10× diluted with deionised water (dH2O), was used twice for 3 min after pretreatment, and for 5 min between each step in the immunostaining process. Immunostaining was done at room temperature using Dako Autostainer Plus (Dako Denmark, Glostrup, Denmark), followed by 8 min of enzyme blocking with Dual Endogenous Enzyme Block, S2003 (Dako). Antibody diluent and primary antibodies were mixed using rabbit von Willebrand factor (Polyclonal Rabbit, A0082, Dako) concentrated at 3.8 µg/L and mouse Ki67 (Clone MIB1, M7240, Dako) at 160 µg/L. The detection system contained EnVision Detection System-Peroxidase/rabbit, K4003 for vWF and Southern Biotech alkaline phosphatase/goat anti-mouse for Ki67, diluted 1:100. Primary antibodies were incubated for 60 min, and the detection system for 30 min. To visualise Ki67, Ferangi Blue (Biocare Medical) diluted with Ferangi Blue Buffer was incubated for 15 min. Sections underwent three dH2O rinses before vWF visualisation with amino-ethyl-carbazole substrate chromogen (Dako) for 15 min. Coverslipping with Dako Faramount aqueous medium (Dako) after two dH2O rinses and immersion in lukewarm water. Ki67-positive cells had blue nuclei and vWF-positive cells reddish-brown cytoplasm (figure 3).

Immunohistochemically stained breast cancer section. Case number 255, basal phenotype. Endothelial cells display von Willebrand factor positively stained cytoplasm as reddish-brown, and Ki67 positively stained nuclei are blue. Scale bar size: 100 μm.
Scoring and reporting
Two observers (AMB and MRK) identified intratumoural vascular hotspots at 20× and 100× magnification. Microvessels were counted by one observer (MRK), who had undergone a training period with a test series of 24 colon sections, until an acceptable level of agreement with a trained observer was achieved over time (kappa >0.6 and Spearman’s rho >0.8). Microvessel counting was done at 400× magnification in 10 visual fields within the hotspot in each tumour. Vessels were counted in consecutive visual fields whenever possible, aiming to commence counting in the region with the highest vessel density. Regions with the highest number of vessels were always included, while areas with normal tissue, fibrosis, sclerosis and necrosis were avoided. Each visual field comprised at least 50% tumour cells. A vascular unit was defined as an endothelial cell or cell cluster with vWF-positive staining, and did not require a lumen. However, in long branches of endothelium or microvascular bundles, each lumen denoted a separate vessel. Stained structures containing a 90° angle were defined as two vessels. Counts from individual visual fields were registered separately.
One visual field had an area of 0.17 mm2, making the total area for MVD assessment 1.73 mm2 per tumour. In previous studies, only the mean vessel counts from 10 visual fields were used.6 7
Sorting strategies
For each tumour, we sorted the vessel counts from each individual visual field in three ways: (1) the original sequence in which they had been counted (MVD-Consecutive); (2) from highest to lowest vessel count (MVD-Decreasing); and (3) randomly (MVD-Random). Within each sorting strategy, we calculated the cumulative field area and mean number of vessels/mm2 by successively adding the vessel count from one visual field at a time.
Statistical analyses
Cox proportional hazards models were used to estimate HRs for BC death according to each sorting strategy, with censoring at death from other causes. For each cumulative field area in each of the three sorting strategies, HR per 10 vessels/mm2 increase in MVD was estimated, with MVD as a continuous variable. The following factors were adjusted for by including them as covariates in all models: year of diagnosis (continuous variable); age at diagnosis (<60, 60–69, 70–79, ≥80 years); tumour diameter (≤20, >20 and ≤50, uncertain but ≥20 mm, uncertain); lymph node status (negative, positive, unknown); grade (1-2, 3); and molecular subtype. Log-minus-log plots and tests based on Schoenfeld residuals were used to confirm that the assumption of proportionality between hazards was met.
We estimated and compared the informativeness of each strategy and cumulative field area for MVD assessment.34 In this study, informativeness reflects how well each cumulative field area of vessel counts within each sorting strategy predicts risk of death from BC. Informativeness was estimated in likelihood ratio (LR) tests and calculated as twice the difference in log-likelihood between a Cox model containing only the covariates listed above, and a model containing a continuous MVD variable in addition to the covariates. The greater the LR test statistic (χ2), the more prognostic information the MVD value provides. Since the reference model (containing only covariates) and the units of the MVD variables (increase in 10 vessels/mm2) were the same for all comparisons, we could compare informativeness across sorting strategies and field areas. For the most informative combination of field area and sorting strategy, we performed separate Cox analyses for each molecular subtype.
Results
Table 1 displays the characteristics of the study population and tumours according to median MVD (72.9 vessels/mm2) across all tumours, calculated for all 10 visual fields combined. Median follow-up time was 4.6 years (IQR 1.9–11.2 years). MVD was below the common median in 69.8% of the luminal A tumours, 41.0% of the HER2 type, 50.8% of the BP and 22.2% of the 5NP. Low MVD was associated with smaller tumour size, but not with stage or lymph node status.
Descriptive characteristics and χ2 tests for the 212 patients with breast cancer according to median MVD value when counted in 10 visual fields
Median MVD in increasing cumulative areas according to each sorting strategy is displayed in table 2. For MVD-Consecutive, median MVD decreased with increasing field area, from 86.5 vessels/mm2 when including one visual field to 72.9 vessels/mm2 for 10 visual fields. In MVD-Decreasing, median MVD was 109.6 vessels/mm2 when only the visual field with the highest MVD was included. In MVD-Random, there were no apparent trends in median MVD with increasing field area, and the difference in median MVD was 1.1 vessels/mm2 between the highest and lowest total areas.
Prognostic informativeness according to cumulative field areas and sorting strategies
Table 2 shows the adjusted relative risk of death from BC per 10 vessels/mm2 increase, LR statistic and relative informativeness of each method. The highest informativeness was found when only the two visual fields with highest MVD were included (MVD-Decreasing, total area 0.35 mm2, HR 1.06, 95% CI 1.03 to 1.10, χ2 16.08). This method was 14% more informative than the original counts in 10 visual fields (total area 1.73 mm2, HR 1.08, 95% CI 1.04 to 1.12, χ2 14.05). Furthermore, within MVD-Decreasing, informativeness fell steadily with increasing cumulative area. For MVD-Consecutive, the highest informativeness was achieved at four visual fields (total area 0.69 mm2, HR 1.07, 95% CI 1.04 to 1.10, χ2 14.36). However, it was less informative than the corresponding field area for MVD-Decreasing (HR 1.06, 95% CI 1.03 to 1.09, χ2 15.69). For MVD-Random, there were no trends in informativeness.
In the original consecutive order, the visual field with the highest vessel count was among the first four visual fields in 122 cases (57.5%), and the one with the second highest count was among the first four visual fields in 91 cases (42.9%). However, both were among the first four in only 60 cases (28.3%). In 57 cases (27.7%), the two visual fields with the highest counts had been included successively.
Table 3 describes the risk of death from BC according to subtype for three methods: the two visual fields with the highest vessel count, the first four visual fields counted consecutively and the original 10 visual fields. For the two visual fields with the highest vessel count, the association with BC death was strongest for patients with luminal A tumours (HR for BC death per 10 vessels/mm2 increase 1.16, 95% CI 1.05 to 1.28), compared with the HER2 type (HR 1.10, 95% CI 1.05 to 1.15) and 5NP (HR 1.09, 95% CI 1.01 to 1.18). For BP, no association was found (HR 1.00, 95% CI 0.95 to 1.06). A similar pattern was seen for the first four visual fields in MVD-Consecutive and for the original 10 visual fields.
Relative risk of death from breast cancer according to MVD, stratified for molecular subtypes
Discussion
We studied prognostic informativeness of different strategies for assessing MVD in 212 BC tumours. MVD in a total field area of 0.35 mm2 in the most vessel-rich region of the tumour provided the most accurate prognostic information. When vessel counts were sorted in decreasing order, prognostic relative informativeness decreased with increasing cumulative area. MVD-Decreasing provided more accurate prognostic information than MVD-Consecutive and MVD-Random. When the most informative method for MVD assessment was applied to each molecular subtype separately, increasing MVD was associated with poorer prognosis in luminal A, HER2 type and 5NP, but not in BP.
A number of factors may account for the variation across studies of the prognostic value of MVD, but lack of consensus in methodology is an important contributor. Vessels are counted in different tumour regions,5 35 36 magnifications,4 5 11 37 total field areas5 11 12 35 37 and antibodies.3 5 35 The definition of what constitutes a vessel, and of how individual vessels should be distinguished, varies.3 18 24 37 In statistical analyses, some use only the maximum vessel count,4 11 13 while others use the average5 12 14 or total count,3 38 and cut-offs for high and low MVD differ. This study analysed one source of discrepancy, the total field area for vessel counting.
The optimal method for assessment of tumour vasculature should be efficient, reproducible, require minimal training and, ultimately, provide meaningful information. Unfortunately, improving one aspect of assessment may be detrimental in others. For instance, observer reproducibility for MVD may be improved when a larger field area is assessed,11 21 but is more time consuming and increases the risk of observer fatigue. In the search of the optimal method, the most important factor is the information it provides, be it about tumour biology, prognosis or treatment prediction. The main focus in this study was on the method’s ability to predict prognosis. Prognostic informativeness as estimated here reflects how well a given model fits with the total amount of observed survival data, and thus the most informative model need not be the one with the strongest association between MVD and prognosis. In the clinical setting, other aspects of MVD should also be considered.
When visual fields were sorted in decreasing order, median MVD fell markedly from 109.6 vessels/mm2 for the first visual field to 72.9 vessels/mm2 for 10 visual fields. Similarly, there was a clear declining trend when visual fields were sorted consecutively. This is in accordance with the findings of others, and supports the claim that MVD assessment in larger total field areas leads to hotspot dilution and MVD underestimation.5 22–24
Smaller cumulative field areas provided more accurate prognostic information compared with larger areas, and our results suggest that it is unnecessary to count vessels in an area >0.69 mm2. Furthermore, a field area of 0.35 mm2 seems to be optimal if counting is done exclusively in visual fields with the highest vessel count. These regions may be difficult to identify prior to vessel counting. However, careful scanning of the hotspot at high magnification may be sufficient for observers to identify them through visual discrimination.
In order to count vessels in 10 visual fields consecutively, we had to construct a path within the hotspot to avoid overlapping. This sometimes required that visual fields with higher vessel counts were included later in the sequence. However, it is possible that the visual fields with highest MVD may have been in close topographical proximity even though they appeared distant in the consecutive counting order. An argument for consecutive counting is to prevent inclusion of the same visual fields twice. However, this is easily avoided when as few as two visual fields are assessed. Moreover, since there were no large differences in informativeness between MVD-Consecutive and MVD-Random, including fields consecutively may be more of a constraint than an aid.
When we repeated survival analyses for each subtype separately using the methods with the highest prognostic informativeness, there were no great differences in results compared with the original model with 10 consecutive visual fields. This implies that the results from our two previous studies were robust.6 7 Although we revealed differences in prognostic informativeness between methods, they were not profound, which could imply that different studies may be comparable despite varying field areas. This favours assessment of smaller field areas, which is less time consuming and reduces the risk of observer fatigue, while providing increased prognostic accuracy.
To the best of our knowledge, this is the first systematic study of the prognostic informativeness of different field areas for vessel counting. The 212 cases are from a well-described cohort with long-term follow-up, where the majority were only treated with surgery. This enables the study of the prognostic informativeness of MVD in the near-natural course of disease progression. The same laboratory and antibodies were used for IHC. A trained observer (MRK) counted vessels in all sections. Vessels were only counted in the consecutive field order, and visual field counts were subsequently sorted into decreasing and random order. Since we did not include the luminal B subtype, and only a small subset of luminal A, the study may not be representative of all BCs. Our results should be validated in an independent series of BC tumours with a representative profile of molecular subtypes.
If MVD is to be used as a diagnostic tool, a simpler and less time-consuming method is needed. The increasing use of digital pathology with automated MVD assessments could provide a solution to observer variability, and other methodological issues presented in this paper. Software analyses have the added advantage of assessing vascular qualities simultaneously, such as vessel size and shape.10 Software is used to estimate endothelial area36 39 or the number of vessels.10 40 Because automated vasculature assessments are more sensitive to background staining and less sensitive to weakly stained vessels, thresholding may be challenging, with the risk of including false positives and overlooking true vessels. Today, programmes need to be adjusted manually by experienced personnel,10 36 39 40 but this could be altered in the future with emerging technology such as artificial intelligence, interactive learning and deep learning algorithms.41 42 Additionally, there are several studies assessing tumour vasculature with ultrasound,43 44 CT45 46 and MRI.19 47 For both imaging and digital pathology, the need for extra equipment and data storage, and the risk of software error must be addressed. Moreover, these methods still require a methodological consensus for studies to be comparable. The findings of this study are applicable to both conventional MVD and novel methods for assessment of tumour vasculature.
Conclusions
The results of this study indicate that in BC, careful selection of vascular hotspots combined with vessel counting in a limited field area provides more accurate prognostic information than counting in larger field areas. MVD decreased with increasing field area and provided the most accurate prognostic information when only the two most vessel-rich visual fields were included (field area 0.35 mm2). These results could bring us closer to a useful approach to vessel assessment.
Take home messages
In breast cancer, microvessel density (MVD) estimated in a small field area within a vascular hotspot had higher prognostic informativeness compared with estimations in larger fields.
MVD assessment in larger field areas led to hotspot dilution and may underestimate MVD.
The prognostic value of MVD varies across molecular subtypes of breast cancer.
Abstract translation
This web only file has been produced by the BMJ Publishing Group from an electronic file supplied by the author(s) and has not been edited for content.Acknowledgments
The authors acknowledge the Department of Pathology, St Olav’s University Hospital, Trondheim, Norway for making the archives available, the Cancer Registry of Norway for the patient data and the excellent technical assistance of senior biomedical engineer Borgny Ytterhus.
References
Footnotes
Handling editor Dhirendra Govender.
Contributors All authors actively contributed to the paper, and take responsibility and accountability for the accuracy and integrity of the work. AMB: study design; selection of vascular hot spots; interpretation of results; writing the article. MRK: study design; selection of vascular hot spots; MVD assessment; statistical analyses; interpretation of results; writing the article. SO: study design; guidance in statistical analyses; interpretation of results; writing the article. HGR: interpretation of results; writing the article.
Funding This study received financial support from the Norwegian University of Science and Technology, Trondheim, Norway.
Competing interests None declared.
Patient consent for publication Not required.
Ethics approval The regional committee for medical and health research ethics approved the study, including the dispensation from the requirement of patient consent (REK Midt-Norge, reference number: 2009/836).
Provenance and peer review Not commissioned; externally peer reviewed.
Data sharing statement There are no additional unpublished data pertinent to this study.