Article Text

Abstract
Aims Gastric cancer is one of the leading causes for cancer mortality. Recent studies have defined the landscape of genomic alterations of gastric cancer and their association with clinical outcomes. However, the pathogenesis of gastric cancer has not been completely characterised.
Methods Driver genes were detected by five computational tools, MutSigCV, OncodriveCLUST, OncodriveFM, dendrix and edriver, using mutation data of stomach adenocarcinoma (STAD) from the cancer genome altas database, followed by an integrative investigation.
Results TTN, TP53, LRP1B, CSMD3, OBSCN, ARID1A, FAT4, FLG, PCLO and CSMD1 were the 10 most frequently mutated genes. PIK3CD, NLRC3, FMNL1, TRAF3IP3 and CR1 were the top five hub genes of the blue coexpression module positively correlated with pathological tumour stage and lymph node stage (p values <0.05 for all cases). Hierarchical clustering analysis of copy number variations of driver genes revealed three subgroups of STAD patients, and cluster 2 tumours were significantly associated with lower lymph node stage, less number of positive lymph nodes and higher microsatellite instability and better overall survival than cluster 1 and cluster 3 tumours (p values <0.05 for all cases, Wilcoxon rank-sum test or log rank test). High expression in one or more of DNER, LHCGR, NLRP14, OR4N2, PSG6, TTC29 and ZNF568 genes was associated with increased mortality (p values <0.05 for all cases, log rank test).
Conclusions The driver genes shed insights into the tumourigenesis of gastric cancer and the genes DNER, LHCGR, NLRP14, OR4N2, PSG6, TTC29 and ZNF568 pave the way for developing prognostic biomarkers for the disease.
- gastric cancer
- genetics
- molecular genetics
This is an open access article distributed in accordance with the Creative Commons Attribution Non Commercial (CC BY-NC 4.0) license, which permits others to distribute, remix, adapt, build upon this work non-commercially, and license their derivative works on different terms, provided the original work is properly cited, appropriate credit is given, any changes made indicated, and the use is non-commercial. See: http://creativecommons.org/licenses/by-nc/4.0/.
Statistics from Altmetric.com
Introduction
Gastric cancer (GC) ranks the fifth in cancer incidence rate and the third in the cause of cancer-associated mortalities throughout the world.1 Annually, the number of new GC cases reaches 1 million, and the number of deaths caused by the disease is 782 685.1 GC could be divided into three subtypes, including adenocarcinoma, undifferentiated carcinoma and signet ring-cell carcinoma.2 Up to now, surgery is the only curative method for patients with GC at early stages. However, a large fraction of patients with GC are diagnosed at late stages.2 Therefore, identifying effective biomarkers is essential for the early diagnosis and prognosis of patients with GC.
In recent years, numerous next generation sequencing studies have characterised the genomics basis and found many actionable genetic drivers in GC. CDH1, RhoA and ARID1A mutations are a common set of genetic variations related to the diffuse subtype of GCs from various regions.3–6TP53, TGFβR2, ARID1A, CDH1, SYNE1 and TMPRSS2 were recurrently mutated genes in 49 late stage GC tumours.4 The Cancer Genome Altas (TCGA) project classified GC tumours into four distinct subtypes, namely Epstein-Barr virus positive, genomic stability, chromosomal unstable and microsatellite unstable subtypes. ERBB2, CCNE1, CCND1 and EGFR amplifications that are mutually exclusive might function as driver alterations in GC tumours.7
Though the genomics landscape of GC has been largely illustrated, the molecular mechanism by which GC initiates and progresses is not completely understood. Therefore, in this study, we applied five distinct computational tools to detect driver genes and conducted integrated analyses on them in 387 stomach adenocarcinoma (STAD) samples.8 The results revealed a set of new driver genes, three subgroups of STAD patients and their association with clinical phenotypes of STAD patients, shedding insights into the pathogenesis of the disease and providing potential prognostic biomarkers and druggable targets in STAD.
Methods and materials
Acquisition of somatic mutations of STAD patients
A total of 208 012 somatic mutations of 387 STAD samples were obtained from the TCGA database (http://gdac.broadinstitute.org/).8 Mutations were classified into nine categories based on their functional impact assessed by Ensembl Variant Effect Predictor9, including missense mutation, nonsense mutation, frame shift indels, in-frame indels, intron, non-stop mutation, silent, untranslated region (UTR), RNA and splicing site mutation. RNA represents somatic mutations in the untranslated region and could be functional possibly through impacting RNA expression level.
Prediction of driver genes in STAD
The prediction of driver genes were conducted by five distinct computational methods, including MutSigCV,10 OncodriveCLUST,11 OncodriveFM,12 dendrix13 and edriver.14 The parameters of all software were used with default values. Driver genes were determined according to the following criteria. The genes with q value <0.05 are statistically mutated (MutSigCV). Genes with q values smaller than 0.05 were considered as drivers (OncodriveFM and OncodriveCLUST). The genes were reported in at least 10% of modules in any K (dendrix). The genes with p values<0.05 were statistically mutated in protein domain regions (edriver).
Gene Ontology (GO) term and Kyoto Encyclopedia of Genes and Genomes (KEGG) pathway enrichment analyses in STAD
GO system classifies genes into a set of predefined terms according to their functional characteristics; GO term enrichment analysis is commonly used to analyse the functional involvement for set of genes. KEGG pathway is a manual curation of signalling pathways, which is the up-to-date understanding on the molecular interaction and relation networks. Enrichment of GO biological process terms and KEGG signalling pathway was performed on the homepage of the Database for Annotation, Visualization and Integrated Discovery (https://david.ncifcrf.gov/) in order to functionally annotate the set of driver genes.15 Driver genes were regarded to be enriched in GO terms or KEGG pathways with significant evidence following the cut-off of Benjamini adjusted p value of less than 0.05.
Weighted gene coexpression network analysis (WGCNA) in STAD
Normalised read counts of driver genes of 415 STAD patients were downloaded from TCGA database. Coexpression network was constructed with the R package of WGCNA using normalised read counts of driver genes.16 The softpower and minimum number of genes of a module were set to 7 and 10, respectively; the remaining parameters were used by default. Coexpression modules were identified via hierarchical average linkage clustering and dynamic tree cut algorithm. Genes that showed high intramodular connectivity were defined as hub genes in the coexpression network. The clinical factors analysed in the WGCNA analysis included patients’ age, gender, pathological stage, number of positive lymph nodes, radiation therapy, targeted molecular therapy, microsatellite instability and survival status. Module–trait associations were assessed by correlating the module eigengene with clinical traits, which enables the identification of modules highly correlated with phenotypes.
Protein–protein interaction (PPI) network analysis in STAD
PPI network was constructed with Search Tool for the Retrieval of Interacting Genes/Proteins (STRING) to prioritise the core driver genes.17 PPI network was imported to Cytoscape for calculation of degree value for each node.18 Hub nodes with the highest degree centrality connect most adjacent proteins in the PPI network. Molecular Complex Detection (MCODE)19 was applied to detect hub clustering modules with default parameters in Cytoscape.
Copy number variation (CNV) analyses in STAD
Focal CNV values of driver genes of 441 STAD samples were obtained from the TCGA database.20 To detect the subgroups of STAD patients, the CNV values of driver genes were grouped using the R package of pheatmap. Difference in patients’ age, pathological stage, number of positive lymph nodes and microsatellite instability was compared among the three subgroups of STAD patients using the Wilcoxon rank-sum test. To analyse the difference in overall survival, Kaplan-Meier (KM) survival analysis was conducted using the R package of survival,21 and difference in overall survival rates was compared among the three subgroups of STAD patients using the log-rank test. P<0.05 was considered as statistically significant.
Survival analyses in STAD
To characterise the association between driver gene expression and patients’ overall survival, STAD patients were divided into the ‘high-expression’ and ‘low-expression’ groups based on the median values. The difference in survival rates was compared between the high-expression and low-expression groups using the R package of survival.22 In order to further confirm the association of driver genes with patients’ clinical outcome, multivariate analysis was carried out between patients’ overall survival and driver gene expression levels and clinicopathological factors using logistic regression model. The clinical features included age, gender, pathological stage, number of positive lymph nodes, radiation therapy, targeted molecular therapy and microsatellite instability. Odd ratio (OR) and p value were extracted from the logistic regression model. P<0.05 was considered statistically significant.
Validation of randomised selection of STAD patients
The cohorts of STAD patients were, to a certain degree, different for somatic mutation, coexpression network, CNV and survival analyses. To evaluate whether selection of STAD patients might affect the findings, clinical factors were compared among the four subsets of STAD patients. The Student’s t-test was used to compare age, number of positive lymph nodes and microsatellite instability; Fisher’s exact test was used to compare gender, cancer stage, radiotherapy, targeted molecular therapy and survival status among the four subsets of STAD patients. P<0.05 was predefined to be statistically significant.
Results
Somatic mutations and driver genes in STAD
A total of 208 012 somatic mutations were detected in 387 STAD samples. Of them, missense (109 607), silent mutations (42 123) and frame shift deletions (20 714) were the most frequent variant types (figure 1A). C>T/G>A, insertions and deletions and A>G/T>C were the top three transitions, with transition rates of 47.7%, 16.6% and 14.5%, respectively in STAD (figure 1B). The somatic mutation density ranged from 0.19 to 241.59 mutations/Mb with an average mutation density of 26.03 mutations/Mb. To understand the cause for the mutation density variation, mutation statuses in the DNA mismatch-repair (MMR) pathway genes MLH1, MLH3, MSH2, MSH3, MSH6 and PMS2 were analysed. We found 64 STAD patients had mutations in any of MMR genes, and the average mutation density in MMR-mutant patients was significantly higher than MMR wide-type patients (54.38 vs 6.87 mutations/Mb, p<0.01, Wilcoxon rank-sum test, figure 1C). The STAD sample that had the highest mutation density (241.59 mutations/Mb) had one mutation in MSH6.

Characterisation of somatic mutations and driver genes in STAD patients. (A) Number of mutation classes with different functional impacts in STAD; (B) somatic mutation signatures in STAD; (C) the difference of somatic mutation densities among MMR-mutant, MMR wild-type samples and STAD samples with mutations in any MMR genes. (D) The overlap of driver genes detected by MutSigCV, OncodriveFM, OncodriveCLUST, dendrix and edriver in STAD. MMR, mismatch-repair; STAD, stomach adenocarcinoma.
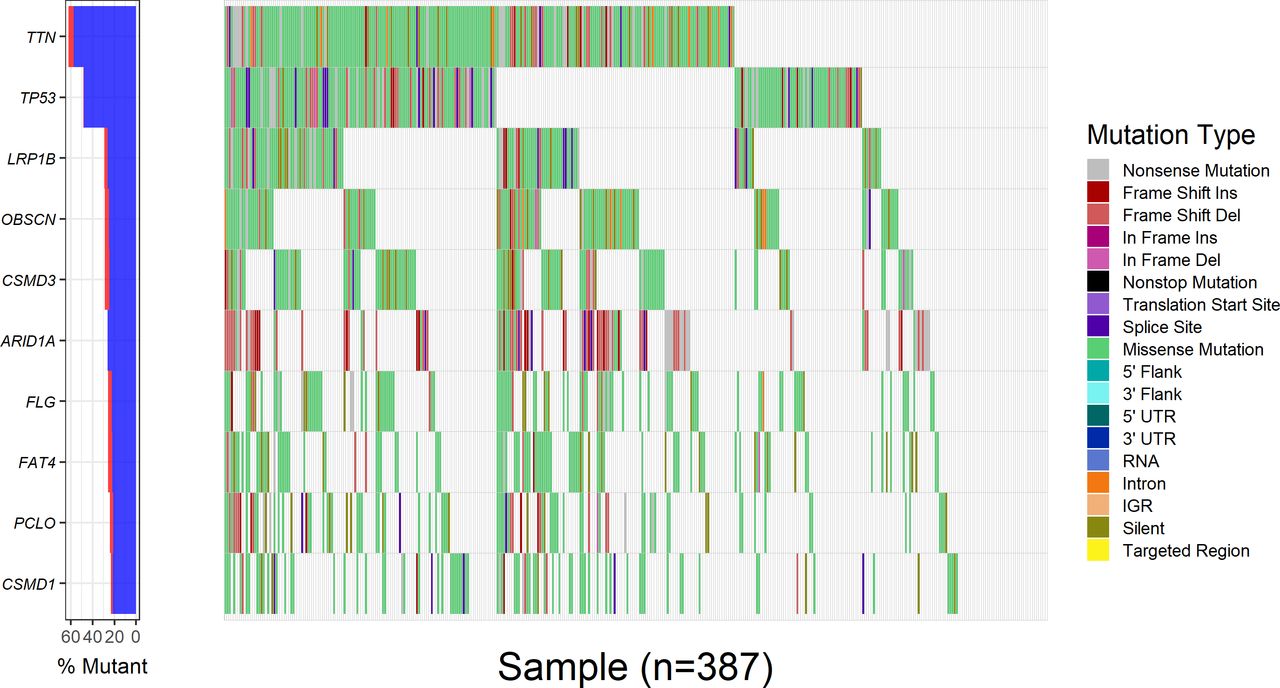
Overall, 18 528 genes were mutated in at least one STAD sample. Eighteen, 32, 13, 114 and 235 driver genes were predicted by mutsigCV, OncodriveFM, OncodriveCLUST, dendrix and edriver, respectively. Combining the five sets of driver genes, 376 driver genes were detected by the five tools. PIK3CA is the overlapping gene predicted by all five tools (figure 1D). Among the 376 driver genes, TTN, TP53, LRP1B, CSMD3, OBSCN, ARID1A, FAT4, FLG, PCLO and CSMD1 were the top 10 frequently mutated genes in STAD, with mutation frequencies of 62%, 48.6%, 29.2%, 28.7%, 28.7%, 26.1%, 25.8%, 25.8%, 24% and 23.3%, respectively, across all STAD samples (figure 2). The large fraction of driver genes were mutated genes at low frequency in STAD, with a mean mutation rate of 7.3%.

Mutation rates of the 20 most frequently mutated driver genes in 387 STAD samples. The left panel showed the mutation frequencies of the 20 most frequently mutated driver genes in 387 STAD samples; the right panel presented the distribution of somatic mutations with different functional impact in 387 STAD samples. STAD, stomach adenocarcinoma.
GO term and KEGG pathway enrichment analyses
GO enrichment analysis showed that driver genes were significantly over-represented in 10 biological processes (Benjamini adjusted p value <0.05), including extracellular matrix organisation, collagen catabolic process, regulation of heart rate by cardiac conduction, actin filament capping, axon guidance, membrane depolarisation during action potential, regulation of heart rate by cardiac conduction and membrane depolarisation during action potential. The driver genes were also significantly enriched in 16 KEGG pathways, including endometrial cancer, Extracellular Matrix (ECM)–receptor interaction, Rap1 signalling pathway, PI3K-Akt signalling pathway, colorectal cancer, pathways in cancer, pancreatic cancer, proteoglycans in cancer and chronic myeloid leukaemia (Benjamini adjusted p value <0.05).
WGCNA analysis in STAD
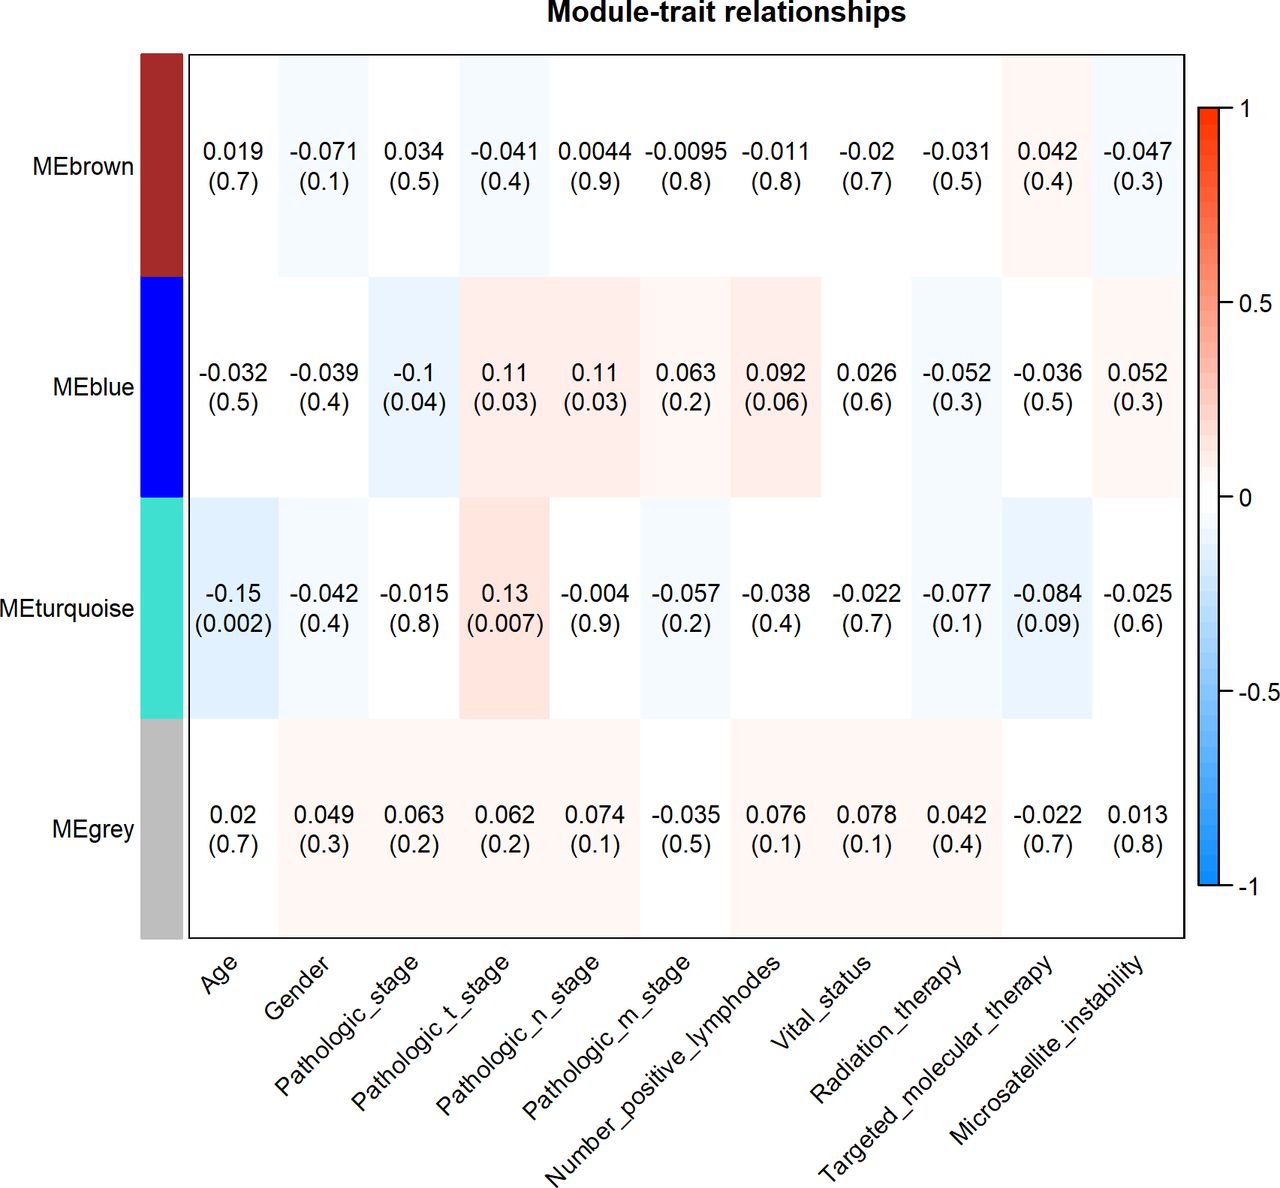
WGCNA analysis found three different coexpression modules, namely the turquoise (94 genes), brown (83 genes) and blue (26 genes) modules in 415 STAD patients (online supplementary figure 1). The module–trait association analysis showed that the blue module exhibited significantly positive correlation with pathological tumour stage and lymph node stage and significantly negative correlation with pathological stage. The turquoise module was significantly positively correlated with pathological tumour stage and negatively correlated with patients’ age (p values <0.05 for all cases, figure 3). ANK2, TLN1, LAMA4, CACNA1C and PKD1 were the top five hub genes in the turquoise module. PIK3CD, NLRC3, FMNL1, TRAF3IP3 and CR1 were the top five hub genes in the blue module.
Supplemental material

The module–trait associations in the WGCNA analysis. Heatmap showed the correlation between module eigengenes and clinical traits. Each cell contained the corresponding correlation and p value. The right bar showed the degree of correlation between module eigengenes and clinical traits.
PPI network analysis in STAD
We also applied STRING to develop the PPI network for driver genes. The PPI network comprised 1138 edges and 376 nodes, with a median node degree of 4 (online supplementary figure 2A). As expected, the PPI network exhibited significantly more interactions than the randomly imputed interactions using similar size of proteins (PPI enrichment p value <0.0001). Then the software cytoscape was used to analyse the degree centrality of driver genes in the PPI network. Five candidate hub nodes, the degree of which was greater than 9 times the corresponding median values, were identified, namely, FN1, TP53, CTNNB1, EGFR and KRAS (online supplementary figure 2A). Moreover, we conducted module analysis and found top three modules with high scores using MCODE (MCODE scores ≥8, online supplementary figure 2B–D). The five candidate hub nodes were included in the three modules.
CNV analyses in STAD
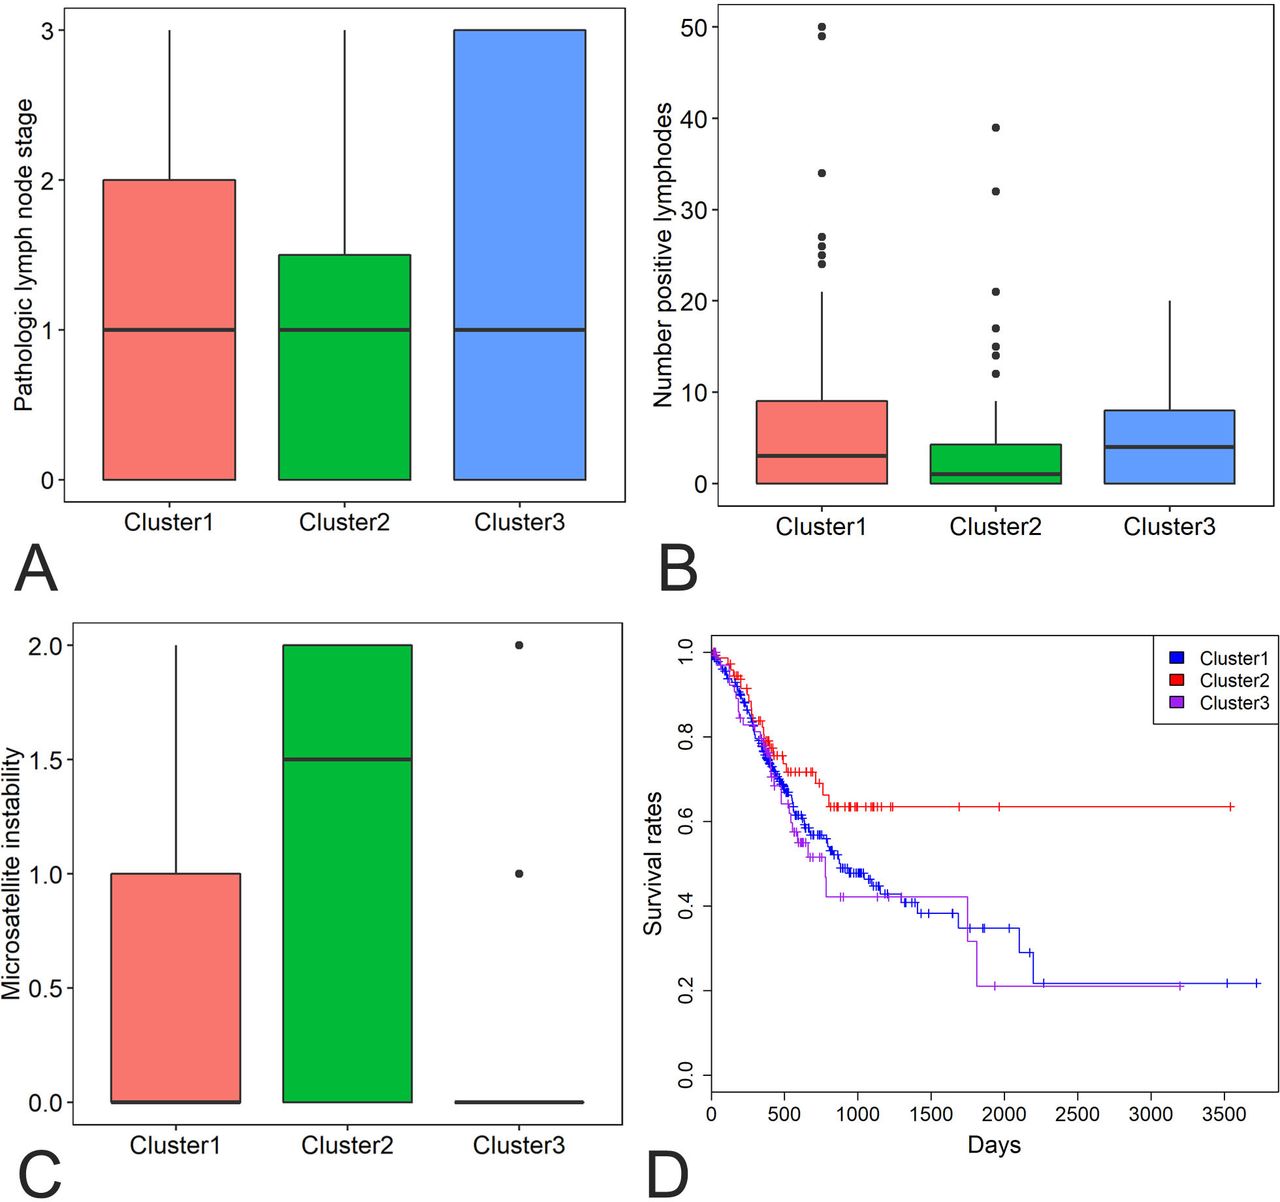
We also obtained focal CNVs of all driver genes of 441 STAD samples from the TCGA database. DCC, SMAD4, MYO5B, BRWD1, UMODL1, APP, SYT4, TMPRSS15, GRIK1 and HERC5 were the 10 most frequently deleted driver genes in STAD, while KCNB1, ARFGEF2, TP53TG5, DPM1, ADCY8, BHLHE23, ZBTB46, EPPK1, LRP12 and PABPC1 were the 10 most commonly amplified driver genes in STAD (online supplementary figure 3). Of the 376 driver genes, 369 genes had CNVs data. Hierarchical clustering of the 369 driver genes revealed three subgroups of STAD patients: those with large CNVs (cluster 1), those with minimal CNVs (cluster 2) and those with intermediate CNVs (cluster 3) (online supplementary figure 4). Cluster 2 tumours showed significantly lower lymph node stage, less number of positive lymph nodes and higher microsatellite instability than cluster 1 and cluster 3 tumours (p values <0.05 for all cases, Wilcoxon rank-sum test, figure 4A,B,C). Moreover, patients in cluster 2 exhibited significantly more favourable survival rates than patients in the clusters 1 and 3 (p value=0.04 and 0.05, log rank test, figure 4D).

Differences in lymph node stage (A), number of positive lymph nodes (B), microsatellite instability (C) and survival rates (D) were compared among the three clusters of STAD patients (1–3). STAD, stomach adenocarcinoma.
Survival analyses in STAD
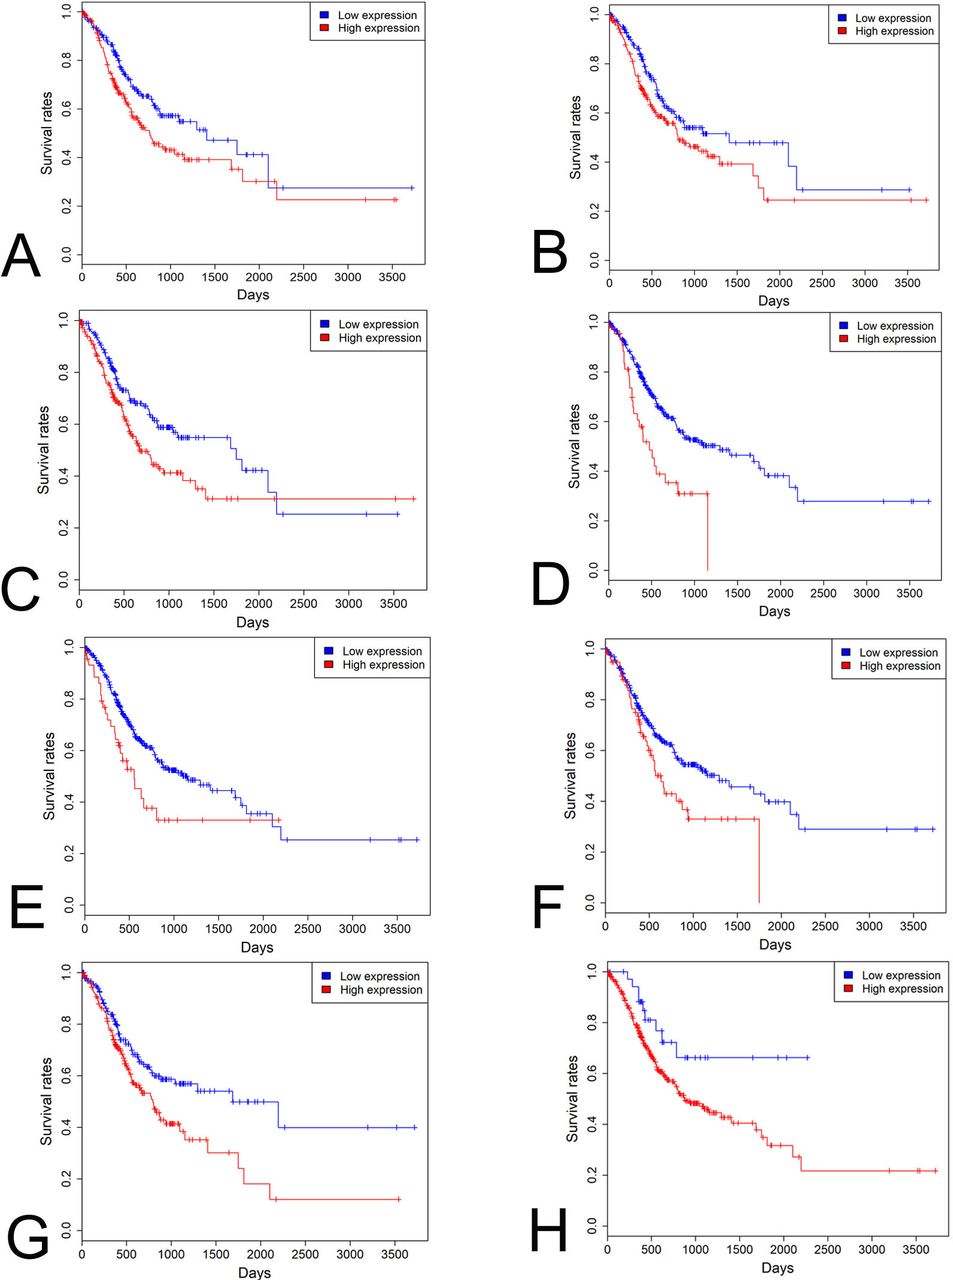
KM analysis indicated that 26 and 44 driver genes exhibited positive and negative correlation with patients’ prognosis respectively in STAD patients (p<0.05 for all cases, log rank test). Multivariate analysis was carried out between patients’ overall survival and clinicopathological factors and driver gene expression levels to further verify the association between the expression of driver genes and patients’ overall survival. Increased expression of DNER, LHCGR, NLRP14, OR4N2, PSG6, TTC29 and ZNF568 was associated with increased mortality (p<0.05 for all cases, log rank test, online supplementary table 1 and figure 5A–G). Lastly, in order to develop a clinically useful strategy for GC prognostication, we pooled the seven prognostic genes (DNER, LHCGR, NLRP14, OR4N2, PSG6, TTC29 and ZNF568) identified above to devise a single prognostic expression panel. High expression of one or more of the seven genes was present in 341 patients and associated with a higher mortality rate in STAD patients (p<0.05, log rank test, figure 5H). These driver genes and the expression panel might be potential prognostic biomarkers for STAD patients in the future.
Supplemental material
Survival analysis of driver genes in STAD. High DNER (A), LHCGR (B), NLRP14 (C), OR4N2 (D), PSG6 (E), TTC29 (F), ZNF568 (G) expression levels and prognostic expression panel (H) was associated with poor prognosis in STAD patients. Red and blue curves represented high and low expression groups, respectively. STAD, stomach adenocarcinoma.
Validation of randomised selection of STAD patients
The datasets were different STAD patient cohorts for somatic mutation, coexpression network, CNVs and survival analyses. To assess the heterogeneity across the different datasets, clinical information was compared among the four sets of STAD patients. No significant difference was observed in patients’ age, microsatellite instability and number of positive lymph nodes (p value >0.05 for all cases, t test, online supplementary table 2), gender, cancer stage, radiotherapy, targeted molecular therapy and overall survival (p value >0.05 for all cases, Fisher’s exact test, online supplementary table 2). The results suggest that the selection of different cohorts of STAD patients was at random and did not significantly impact the results in our study.
Discussion
The accumulation of driver mutations that confer a proliferation advantage to cancer cells plays a key role in the formation of cancer.23 Driver genes are enriched for driver mutations, and detection of these driver genes is critical to the molecular characterisation of cancer genomes.24–28 Numerous computational tools have been developed to predict driver genes based on a variety of algorithms. The MutsigCV prioritises significantly recurrently mutated genes in a large cohort of cancer samples by comparing the actual mutation rate with the baseline mutation rate. In the MutSigCV analysis, p value was calculated for the gene by convoluting the background distributions of all the mutation types and determining the probability of meeting or exceeding that score by background mutation alone.10 OncodriveFM first uses three scoring systems, including SIFT,29 PolyPhen230 and MutationAssessor,31 to measure the damaging impact of somatic mutations. A uniform score was produced by combining the three different functional scores using transFIC.32 Then OncodriveFM12 prioritises the genes that accumulate variants with high functional impact and exhibit significantly higher functional scores than random permutations. OncodriveCLUST builds the background model by evaluating coding-silent mutations and detects genes that show a significant bias towards mutation clustering within the protein sequence.11 The dendrix finds sets of genes whose mutations occurred in the majority of cancer samples, while display high exclusivity.13 E-Driver is an algorithm to investigate the somatic missense mutation distribution within the functional regions of protein and finds the genes that show a bias towards enrichment of missense mutations in comparison with other regions of the same protein.14 In this study, five computational tools were used to predict driver genes using complementary algorithms rather than somatic mutation frequencies; by combining the five tools, we were able to identify a more comprehensive list of driver genes than that predicted by MutSigCV alone.33–35
We applied five computational algorithms, MutSigCV, OncodriveCLUST, OncodriveFM, dendrix and edriver, to detect driver genes using somatic mutations of 387 STAD samples. TP53, ARID1A and CDH1 were predicted as driver genes in STAD, which is in concordance with previously published studies.3–6 Of the 376 driver genes, some are known oncogenes,36 such as CTNNB1, EGFR, PIK3CA and ROS1, while others are tumour suppressor gene,37 such as ATM, SMAD4, SMARCA4, CHEK2 and RHOA. Notably, a large fraction of driver genes was mutated at low frequencies and first reported as driver genes in STAD, such as FSHR, ACTN4, ZBTB46 and RHOA. These new driver genes provide promising candidates for functional validation in future studies.
The blue and turquoise modules exhibited significant correlation with pathological stage and patients’ age in the WGCNA analysis. ANK2, TLN1, LAMA4, CACNA1C and PKD1 were the top five hub genes in the turquoise module. PIK3CD, NLRC3, FMNL1, TRAF3IP3 and CR1 were the top five hub genes in the blue module. These results suggest that these genes were intensively correlated with other genes at the mRNA expression level. FN1, TP53, CTNNB1, EGFR and KRAS were the hub nodes in the PPI network. Therefore, these driver genes may have key roles in the coexpression and PPI networks. Further analysis of the driver genes identified subsets of STAD patients who showed significantly different survival rates. STAD patients with minimal CNVs in driver genes (cluster 2) showed more favourable survival rates than patients with intermediate and substantial CNVs (clusters 1 and 3). By contrast, those STAD patients exhibiting high expression in one or more of the seven genes, DNER, LHCGR, NLRP14, OR4N2, PSG6, TTC29 and ZNF568, were associated with a poor prognosis. Identifying these subgroups of STAD patients might be of importance in clinical settings. Cytological or surgical STAD tumours exhibiting minimal CNVs in driver genes and low expression in any of the seven genes might be associated with a decreased mortality. Therefore, these patients are recommended to undergo less aggressive treatment and frequent follow-up.
Take home messages
A total of 376 driver genes was identified. TTN, TP53, LRP1B, CSMD3, OBSCN, ARID1A, FAT4, FLG, PCLO and CSMD1 were the 10 most frequently mutated genes.
PIK3CD, NLRC3, FMNL1, TRAF3IP3 and CR1 were the top five hub genes in the blue module positively correlated with pathological tumour stage and lymph node stage.
Hierarchical clustering analysis of copy number variations of driver genes revealed three subgroups of stomach adenocarcinoma patients, and cluster 2 tumours were significantly associated with lower lymph node stage, less number of positive lymph nodes and higher microsatellite instability and better overall survival than cluster 1 and cluster 3 tumours.
High expression in one or more of DNER, LHCGR, NLRP14, OR4N2, PSG6, TTC29 and ZNF568 genes was associated with increased mortality.
References
Supplementary materials
Supplementary Data
This web only file has been produced by the BMJ Publishing Group from an electronic file supplied by the author(s) and has not been edited for content.
Footnotes
Handling editor Runjan Chetty.
Contributors Not applicable.
Funding The authors have not declared a specific grant for this research from any funding agency in the public, commercial or not-for-profit sectors.
Competing interests None declared.
Patient consent for publication Not required.
Provenance and peer review Not commissioned; externally peer reviewed.
Data availability statement Data are available on reasonable request. All data relevant to the study are included in the article or uploaded as supplementary information. The datasets generated and/or analysed during the current study are available from the corresponding author on reasonable request.