Article Text

Abstract
Aims Methionyl–tRNA synthetase (MARS) is known to play a critical role in initiating translation and protection against cellular damages in vivo. The aim of this study was to clarify the role of MARS in breast cancer (BC) progression.
Methods The expressions of MARS messenger RNA (mRNA) and protein in human BC tissues and adjacent non-cancerous tissues were detected by quantitative real-time PCR, western blot and immunohistochemistry. The prognostic potential of MARS in patients with BC was assessed by univariate and multivariate survival analyses. The association between the MARS expression and BC progression was further evaluated by the bioinformatics database of UALCAN, Gene Expression Profiling Interactive Analysis (GEPIA) and Gene Expression Database of Normal and Tumor Tissues (GENT). The role of MARS in the proliferation, migration and epithelial-to-mesenchymal transition (EMT) of human breast cancer cell line (MCF-7 cells) was investigated after siRNA transfection.
Results The expression level of MARS mRNA in the fresh BC tissues was significantly higher than that in the adjacent tissues. Immunohistochemistry showed that the expression level of MARS was closely associated with the clinicopathologial parameters of patients with BC, including the HER-2 status, Ki-67 status, molecular classification, tumour grade, N stage and tumour, node, metastasis (TNM) stage, and this finding was further confirmed by UALCAN database. The Kaplan-Meier analysis showed that high MARS expression and TNM stage were predictors of poor prognosis of patients with BC. The proliferation, migration and EMT capabilities of MCF-7 cells were significantly suppressed after MARS knockdown. An overview of UALCAN, GEPIA and GENT results suggested that MARS may be an oncogene of BC, as well as a potential therapeutic target of this malignant tumour.
Conclusions High expression level of MARS in the human BC tissues was significantly associated with the unfavourable prognosis of patients with BC, suggesting that MARS may serve as a potential prognostic marker for the clinical diagnosis and prognostic prediction of BC.
- breast cancer
- tumour markers
- tumour angiogenesis
- diagnostics
This is an open access article distributed in accordance with the Creative Commons Attribution Non Commercial (CC BY-NC 4.0) license, which permits others to distribute, remix, adapt, build upon this work non-commercially, and license their derivative works on different terms, provided the original work is properly cited, appropriate credit is given, any changes made indicated, and the use is non-commercial. See: http://creativecommons.org/licenses/by-nc/4.0/.
Statistics from Altmetric.com
Introduction
Breast cancer (BC) is one of the most common malignant tumours in women worldwide, seriously threatening their physical and mental health.1–3 In 2017, there were more than 250 000 estimated new cases and 40 610 estimated deaths in the USA with 1.6 million estimated new cases and more than 1.2 million estimated deaths each year in China.4 Although remarkable technological progress has been made in the diagnosis and treatment of cancer over the past decades, the survival and systemic treatments of patients with advanced BC remain unsatisfactory, due to the little known about the specific progression mechanism of primary malignant tumours and the relationship between ductal carcinoma in situ and invasive cancers.5 6
The pathogenesis of BC in vivo is considered to be related to diverse transformations, including genetic mutation in an aberrant tissue mass and accelerated cellular metabolism with aggressively proliferative abilities of cancer cells, which further lead to disturbed cellular and mitochondrial redox homeostasis,7 8 increased cellular reactive oxygen species (ROS) production and enhanced epithelial-to-mesenchymal transition (EMT) process.9–11 When ROS levels overwhelm the balances of the cellular antioxidant defence system, chronic oxidative stress occurs,12 resulting in direct or indirect damages to nucleic acids, proteins and lipids, thereby altering their functions and resulting in hypertension,13 ageing14 and carcinogenesis15 in vivo.
As one of the ROS scavengers to protect against oxidative stress in vivo, methionyl–tRNA synthetase (MARS), belonging to the transfer RNA (tRNA) family, has been proven as a potential prognostic marker candidate for the clinical prognostic prediction of non-small-cell lung cancer (NSCLC) in patients.16 MARS can also be used to detect intracellular oxidative stress and controls protein synthesis under oxidative stress.17 However, the role of MARS during BC progression remains elusive. The aims of the present study were to compare the expression level of MARS in human BC tissues and adjacent non-cancerous tissues by quantitative real-time PCR (qRT-PCR), western blot and immunohistochemistry, and to explore the association between the MARS expression level and the clinicopathological characteristics of patients with BC. The prognostic implication of MARS in BC progression was also investigated. The relationship between MARS expression and BC progression was further investigated by bioinformatics, and the effect of MARS knockdown by siRNA transfection on the proliferation, migration and EMT capabilities of human breast cancer cell line (MCF-7 cells) was also investigated to clarify the association between MARS expression and BC progression.
Materials and methods
Patient sample collections
Forty pairs of fresh BC tissues and adjacent non-cancerous tissues (about 5 cm distances from the BC tissues) were randomly collected. The patients aged from 32 to 81 years with a median of 57.43 years. The 40 patients included 20 postmenopausal, 9 premenopausal and 11 perimenopausal women. The pathological results showed stage I in 1, stage II in 20 and stage III in 19 patients.
Additionally, 142 paraffin-embedded BC tissues and adjacent non-cancerous tissues were collected between January 2011 and January 2012. All patients had signed the informed consent before this study. None of the patients had undergone radiotherapy/chemotherapy before sample collection. The results of immunohistochemistry analysis are detailed in table 1.
Associations of MARS expression with clinical characteristics and selected biological markers of BC
The clinical diagnosis of 142 paraffin-embedded BC tissues was confirmed independently by two pathologists according to the WHO criteria. All cases in this study had 100% follow-up rates and clinicopathological information including age, tumour grade, tumour size, histological types, oestrogen receptor (ER), progesterone receptor (PR), human epidermal growth factor receptor 2 (HER-2), molecular classification, Ki-67 status, N stage and tumour, node, metastasis (TNM) stage. The cut-off values of ER, PR, HER-2 and Ki-67 staining scores of each patient with BC were set according to our previous study.18
qRT-PCR
Total messenger RNA (mRNA) of these fresh BC tissues and their adjacent tissues (n=40) was extracted with Trizol solution (79306, Gibco, Shanghai, China), followed by cDNA synthesis by commercial kits and PCR amplifications.
The mRNA primers for MARS were as follows: forward primer as 5’-CACAGCTTGAGTCGTCAGAAC-3’ and reversed primer as 5′- CGGGATCTTGCAGTAATGGGTAT-3′ with the primers for glyceraldehyde 3-phosphate dehydrogenas (as GAPDH) as internal controls as follows: forward primer as 5′-TGAACGGGAAGCTCACTG-3′, reversed primer as 5′-GCTTCACCACCTTCTTGATG-3′. The relative expression levels of MARS in these fresh BC tissues and adjacent tissues were calculated by the 2−ΔΔCt method with the threshold cycle (Ct) average calculated.19
Western blot
To analyse the expression of MARS in the fresh BC tissues and adjacent tissues (n=40), the protein lysates were quantified by commercial BCA kits (BioRad, 163–2086, Beijing, China). After protein quantification, the proteins were resolved to fresh sodium dodecyl sulphate-polyacrylamide gel electrophoresis gels (Solarbio, P1200, Beijing, China) and transferred to polyvinylidene fluoride membranes (Millipore, IPVH00010, Beijing, China), followed by antibody incubation overnight with rabbit anti GAPDH (1:1000; Abcam, ab8245, Shanghai, China) as loading controls and rabbit anti-MARS (1:1000; Proteintech, 14 829–1-AP, Wuhan, China), respectively. After three washes with Tris buffered saline with Tween 20 (as TBST) solution, the membranes were incubated with secondary antibody solutions (1:500; Abcam, Cambridge, MA, USA) at room temperature for 1 hour. The blots were visualised with enhanced chemiluminescence solution (Promega, Beijing, China) and recorded with ChampChemi 610 Plus. The protein expression levels normalised to GAPDH were analysed and calculated by Image J (https://imagej.nih.gov/ij/).20
Immunohistochemistry analysis
The paraffin-embedded sections of BC tissues and adjacent tissues (n=142) were deparaffinised in Vanclear solution three times (each time for 7 min), rehydrated in graded ethanol (100%–100%–95%–95%, each ethanol for 5 min) and washed with phosphate-buffered saline (PBS) solution (0.01 M) three times (each time for 5 min) to remove the residual solutions. The antigen retrieval of the paraffin sections was conducted by boiling under pressure in EDTA solution for 18 min, followed by incubation at 37℃ with 10% goat serum (Solarbio, SL039, Beijing, China) for 30 min to block these non-specific bindings. The sections were incubated overnight with a rabbit anti-MARS antibody (1:300; Proteintech, 14 829–1-AP, Wuhan, China) at 4 ℃ and subsequently with a goat anti-rabbit HRP secondary antibody (1:200, ZSGB-BIO, ZDR-5306, Beijing, China) at 25℃ for 2 hours. After three washes with PBS for 5 min each, the immunostained sections were treated with freshly prepared 3,3'-diaminobenzidine tetrahydrochloride (DAB) solution (Solarbio, DA1010, Beijing, China) for 5 min in the dark, followed by counterstaining with haematoxylin solution and sealing with neutral balsam.
The intensity and percentage of MARS-positive cells in these immunostained sections were scored by two pathologists independently who were blind to the experimental conditions, as 0 for negative, 1 for weak, 2 for moderate and 3 for strong intensity; and 0 for negative, 1 for 10%–50%, 2 for 51%–80% and three for >80% positive tumour cytoplasm.16 The final MARS staining scores (multiplies of intensity and percentage scores) was defined as low expression level when the staining score was <6 and high expression level when the staining score was ≥6.
Bioinformatics analysis of MARS expression level in different cancers
Using the customisable functions of Gene Expression Profiling Interactive Analysis (GEPIA), the expression levels of MARS were further assessed in adrenocortical carcinoma (ACC), kidney renal clear cell carcinoma (KIRC), kidney renal papillary cell carcinoma (KIRP), brain lower-grade glioma (LGG), liver hepatocellular carcinoma (LIHC), mesothelioma (MESO), sarcoma (SARC) and uveal melanoma (UVM).
Using the functional analysis of UALCAN, the MARS expression profiles based on major cancer stages, individual cancer stages, patient’s race, patient’s age, major subclasses and menopause status were analysed.21
Using the Gene Expression Database of Normal and Tumor Tissues (GENT) database, we further analysed the pattern of MARS expression across diverse human normal and tumour tissues with U133plus2 platform.22
Cell culture and siRNA transfection
MCF-7 cells were purchased from the Institute of Cell Biology of the Chinese Academy of Sciences (Shanghai, China) and cultured in the fresh growth medium as Dulbecco's minimum essential medium (DMEM) (10 566–016; Invitrogen, Shanghai, China) supplemented with 10% fetal bovine serum (FBS) (10091148, Gibco) and 100 U/mL penicillin/streptomycin (15070063, Invitrogen) at 37°C in a humidified chamber containing 5% CO2.
MCF-7 cells were transfected with different MARS siRNAs or a negative control siRNA with the lipofectamine transfection 2000 reagent (11668027, Invitrogen) according to the manufacturer’s instructions. The sequences of MARS siRNA oligos were as follows:
MARS-siRNA1 (MARS-Homo-1278): forward primer as FAM 5′-GCAAGAUACUGUGGAGCAATT-3′, reversed primer as 5′-UUGCUCCACAGUAUCUUGCTT-3′;
MARS-siRNA2 (MARS-Homo-2042): forward primer as FAM 5′-GGACGGACCUGCUGCUGAATT-3′, reversed primer as 5′-UUCAGCAGCAGGUCCGUCCTT-3′;
MARS-siRNA3 (MARS-Homo-2267), forward primer as FAM 5′-CCAUAUCUCGACAUGGCAATT-3′, reversed primer as 5′-UUGCCAUGUCGAGAUAUGGTT-3′.
RT-PCR and western blot analyses
After siRNA transfection treatments for 24 hours, the total mRNA and proteins of MCF-7 cells from different groups were extracted to analyse the relative expression of MARS mRNA and proteins.
Cell proliferation assays
After siRNA transfection, the proliferative abilities of MCF-7 cells from different groups were measured at 24, 48 and 72 hours using commercial cell counting kit-8 (CCK8, DOJINDO, Kumamoto, Japan). The absorbance values at 450 nm were measured with a Multiskan GO microplate spectrophotometer (Thermo Fisher Scientific, China), respectively, followed by calculation of the relative cell growth to analyse the cell proliferative potentials.
Wound healing assay
After siRNA transfection treatments for 24 hours, a wound was made with a 200 µL sterilised pipette tip for the following analyses. After the removal of cellular debris and these non-adherent cells, the cells from different groups were incubated for 24 hours with the cell photographs randomly recorded at 0 and 24 hours after wounding, respectively.
EMT analysis
After siRNA transfection treatments for 24 hours, the EMT capabilities of MCF-7 cells from different groups were analysed by qRT-PCR with the relative mRNA expression levels calculated by the 2−ΔΔCt method. The primers for the following qRT-PCR analyses were as follows:
E-cadherin: forward primer 5′-CCCTTCACAGCAGAACTAACA-3′, reversed primer 5′-TTGGGTTGGGTCGTTGTA-3′.
Vimentin: forward primer 5′-AATGACCGCTTCGCCAAC-3′, reversed primer 5′-CCGCATCTCCTCCTCGTAG-3′.
Zeb-1: forward primer 5′-CCTGTCCATATTGTGATAGAGGC-3′, reversed primer 5′-ACCCAGACTGCGTCACATGT-3′.
Snail: forward primer 5′-AGACGAGGACAGTGGGAAAG-3′, reversed primer 5′-AGATCCTTGGCCTCAGAGAG-3′.
GAPDH: forward primer 5′-TGAACGGGAAGCTCACTG-3′, reversed primer 5′-GCTTCACCACCTTCTTGATG-3′.
Statistical analysis
All statistical analyses were conducted by the software of Statistical Package for the Social Sciences (SPSS, IBM V.19.0). The Wilcoxon signed-rank non-parametric test was used to calculate the relative expression levels of MARS mRNA in the fresh BC tissues and adjacent tissues. The correlations between MARS expression and clinicopathological parameters were analysed by Pearson’s χ2. The survival curves of patients with BC were analysed by the Kaplan-Meier and log-rank test. The model of multivariate Cox regression was further used to calculate the prognostic factors in univariate analysis. A p value of <0.05 was considered statistically significant.
Results
MARS expression levels in fresh BC tissues by qRT-PCR analyses and western blot
The results of qRT-PCR analysis showed that the relative expression level of MARS mRNA in the fresh BC tissue was significantly higher than that in the adjacent tissue (0.8938±0.1672 vs 0.6689±0.1607, 1.34-fold, p<0.001) (figure 1).

Relative expression of MARS mRNA in fresh breast cancer tissues and adjacent tissues. MARS, methionyl–tRNA synthetase. mRNA, messenger RNA.
Furthermore, the expression levels of MARS protein in the fresh BC tissues and adjacent tissues were detected by western blot. As shown in figure 2, the results showed that there were 35 cases (87.50%) of the 40 BC tissues with higher expression levels of MARS protein than that in the adjacent tissues and three cases (7.50%) of BC tissues with the same expression levels compared with the adjacent tissues. There were only two cases (5.00%) of BC tissues with lower expression levels of MARS than that of the adjacent tissues.

Representative MARS expression levels in fresh BC tissues and As. Note: the MARS expression level in fresh BC tissues was significantly higher than that in adjacent tissues. GAPDH was used as a loading control. A, adjacent tissue; BC, breast cancer; C, cancer tissue; MARS, methionyl–tRNA synthetase.
The above results confirmed that both expression levels of MARS gene and protein in fresh human BC tissues were significantly higher than that in the corresponding adjacent tissues (p<0.05).
Expression of MARS in the BC tissues by immunohistochemistry
As shown in figure 3, MARS was mainly distributed in the cytoplasm of BC cells. High MARS expression levels were detected in 56.34% (80/142 cases) of the BC tissues vs 35.92% (51/142 cases) in the adjacent tissues (χ2=11.917, p=0.001).
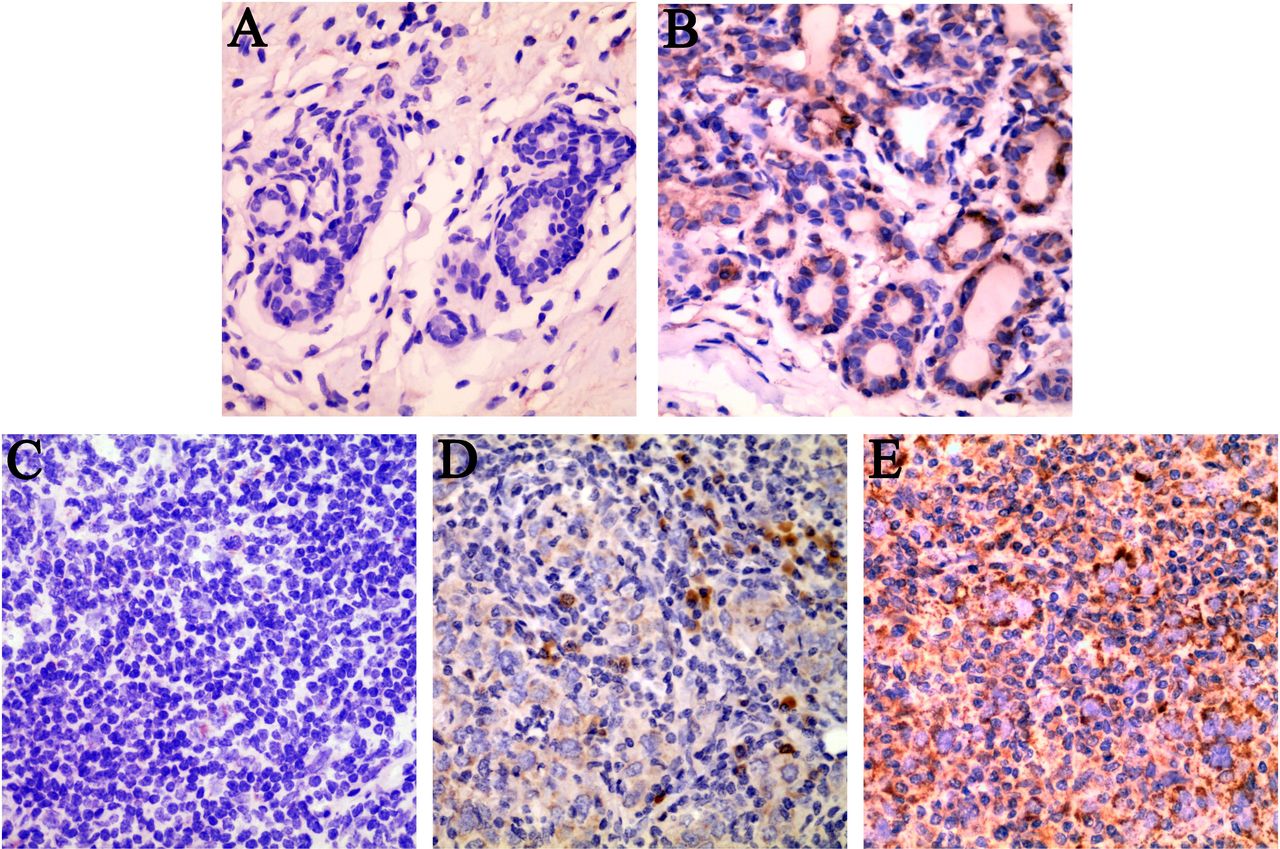
Representative results of MARS locations and expressions in fresh BC tissues and adjacent tissues. (A) No MARS protein expression in the cytoplasm of adjacent tissues. (B) Low MARS protein expression in the cytoplasm of adjacent tissues. (C) Low MARS protein expression in the cytoplasm of BC cells. (D) Moderate MARS protein expression in the cytoplasm of BC cells. (E) High MARS protein expression in the cytoplasm of BC cells. Original magnification, ×400 (A–E). BC, breast cancer; MARS, methionyl–tRNA synthetase.
Associations between MARS expression and the clinicopathological characteristics of patients with BC
The associations between MARS expression and clinicopathological characteristics of patients with BC were analysed and the results are shown in table 1.
The results showed that the high expression of MARS was significantly associated with tumour grade (χ2=8.506, p=0.014), HER-2 status (χ2=6.962, p=0.008), Ki-67 status (χ2=5.938, p=0.015), molecular classification (χ2=10.565, p=0.014), N stage (χ2=5.054, p=0.025) and TNM stage (χ2=8.043, p=0.018). Meanwhile, the expression level of MARS protein was not significantly related to patient’s age, ER status, histological types, tumour size and PR status (p>0.05) (table 1).
High MARS protein expression predicts poor prognosis of patients with BC
As shown in table 2, the high expression levels of MARS (HR=4.844, p<0.001), tumour grade (HR=1.539, p=0.038), HER-2 status (HR=2.302, p=0.006) and TNM stage (HR=2.648, p<0.001) were significantly associated with the poor overall survival (OS) of patients with BC.
Univariate and multivariate analyses of prognostic factors in BC for 5-year overall survival
As shown in table 2, high MARS expression (HR=3.618, p=0.002) and TNM stage (HR=2.351, p<0.001) were independent prognostic markers for poor OS of patients with BC. As shown in figure 4, patients with BC with high expression of MARS had poorer OS as compared with those with low or no MARS expression. In addition, patients with BC with TNM stage III+IV had worse OS as compared with those with stages I and II.

Survival analyses of patients with BC by Kaplan-Meier analysis. (A) OS of patients with BC with high expression level of MARS (green line) was significantly lower than that of patients with BC with low or no MARS expression (blue line). (B) OS of patients with BC with TNM stage Ⅲ+Ⅳ (black line) was significantly lower than that in patients with BC with TNM stages Ⅰ (blue line) and Ⅱ (green line). BC, breast cancer; Cum, cumulative; MARS, methionyl–tRNA synthetase; OS, overall survival; TNM, tumour,node, metastasis.
Survival analysis of MARS genes in different cancers
The results of the GEPIA dataset with the cancer genome atlas (TCGA) sample analyses indicated that the high expression of MARS conferred survival disadvantages to patients with ACC (log rank p=2.7e-06, HR (high)=8.8); KIRC (log rank p=7.5e-08, HR (high)=2.3); KIRP (log rank p=0.0062, HR (high)=2.4); LGG (log rank p=0.0012, HR (high)=1.8); LIHC (log rank p=0.0038, HR (high)=1.7); MESO (log rank p=1.5e-06, HR (high)=3.2), SARC (log rank p=0.038, HR (high)=1.5) and UVM (log rank p=0.0014, HR (high)=5.9) (figure 5).
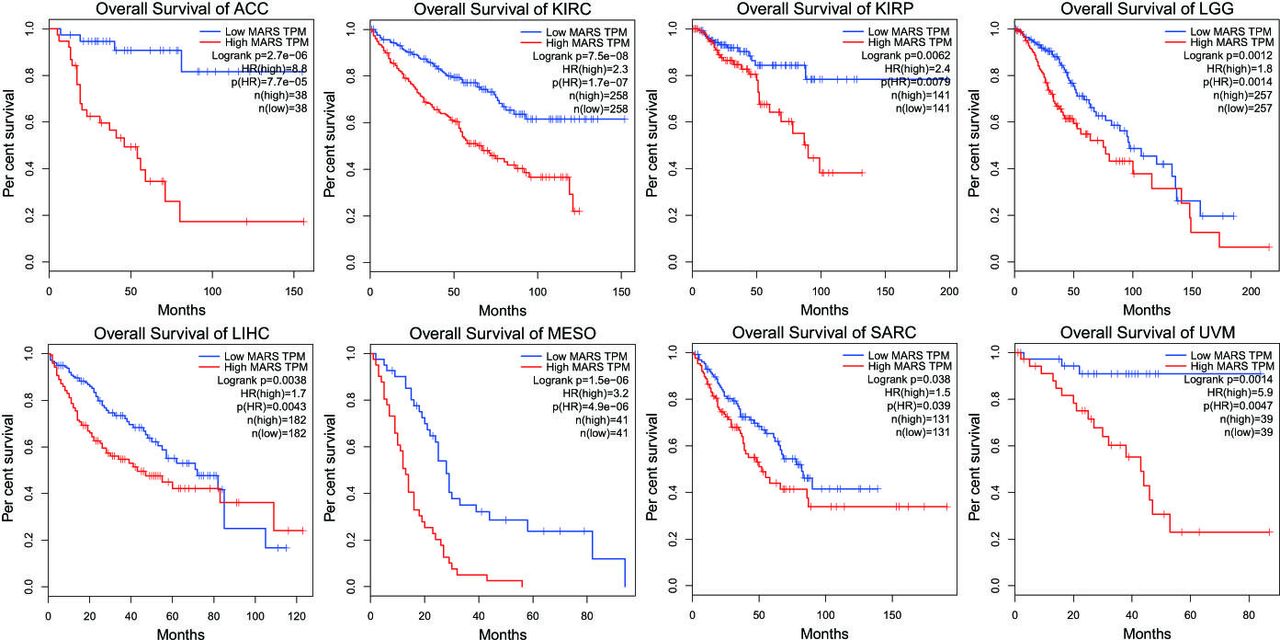
Expressions of MARS protein in different cancers. Note: Overall survival rates in patients with ACC, KIRC, KIRP, LGG, LIHC, MESO, SARC and UVM with high expression levels of MARS protein (red line) were statistically lower than those in patients with low and no MARS expression (blue line). ACC, adrenocortical carcinoma; KIRC, kidney renal clear cell carcinoma; KIRP, kidney renal papillary cell carcinoma; LGG, lower-grade glioma; LIHC, liver hepatocellular carcinoma; MARS, methionyl–tRNA synthetase; MESO, mesothelioma; SARC, sarcoma; UVM, uveal melanoma; TPM, transcript per million;TCGA The Cancer Genome Atlas.
Survival analysis of MARS with patients with BC
Analysis on the relationship between MARS expressions and major cancer stages indicated that there were significant differences between the expression levels of MARS in the normal and cancer tissues (p<1e-12), which is consistent with our observations (figure 6).

Relationships between MARS expression and major cancer stages, individual cancer stages, patient’s race, patient’s age, major subclasses and menopause status. Note: Labelling with the different letter in each column indicates significant differences between the groups (p<0.05). MARS, methionyl–tRNA synthetase; TNBC, triple negative breast cancer; BRCA, breast invasive carcinoma.
The relationship between MARS protein expression and individual cancer stages indicated that there were significant differences between normal and different cancer stages. The results further showed that there was a significant difference between stages 1 and 3 (p=3.98e-02). High MARS expressions were significantly different between Asians and Caucasians (p=4.48e-02). The pattern of MARS expression with patient’s age was consistent with our studies that there was no significant difference between different age groups (p>0.05).
The results of MARS expression level in major cancer subclasses showed that the MARS expression level in luminal cancer was lowest, which was significantly different from HER-2-positive cancer (p=1.38e-03) and triple negative breast cancer (TNBC) (p=2.52e-03). However, there was no significant difference between the MARS expression levels in HER-2-positive cancer and TNBC (p>0.05). Furthermore, there were no significant differences between the MARS expression level and different menopause stages (as premenopause, perimenopause and postmenopause) (p>0.05).
MARS expression pattern across diverse normal and tumour tissues
As expected, the overexpression level of MARS in a subset of BC tissues was significantly higher than that in the adjacent normal tissues (figure 7). In addition, overexpression levels of MARS in a subset of patients with adrenal gland, bladder, cervix, colon, endometrium, oesophagus, kidney, liver, lung, prostate, small intestine, skin, spleen and testis cancer were also observed.
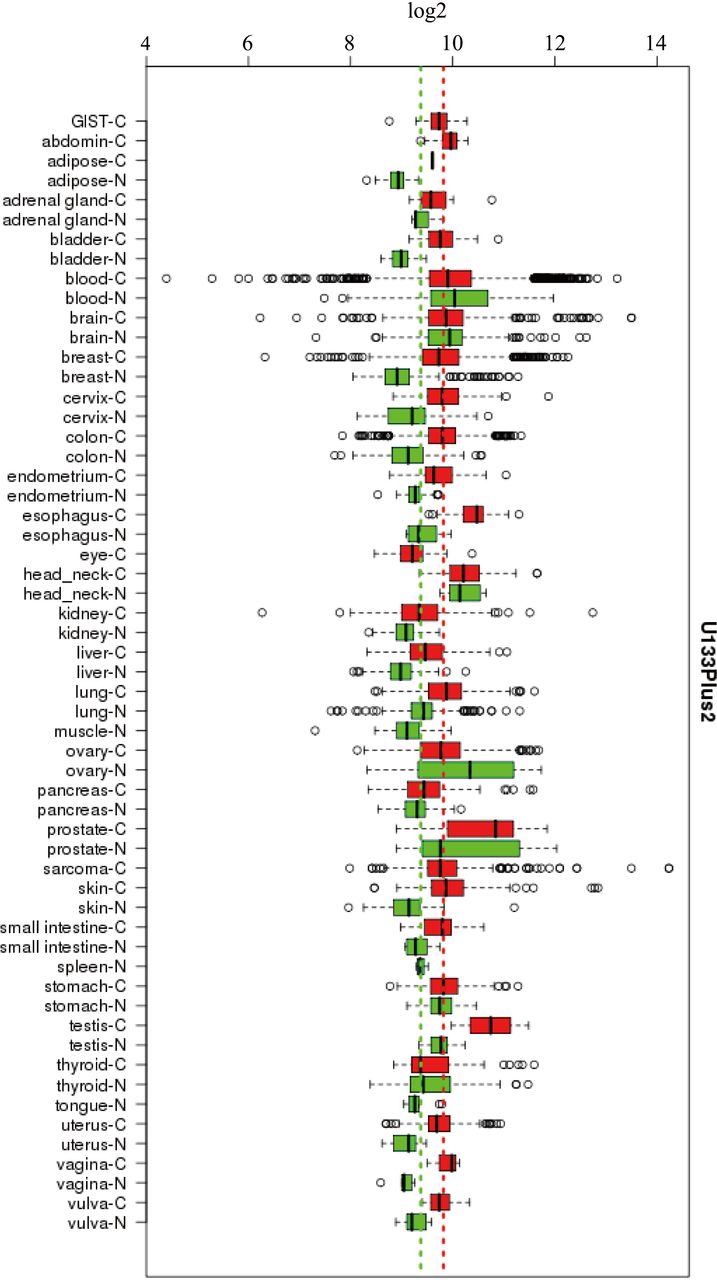
Expression levels of MARS protein in different human C and N with U133plus2 platform. GIST, gastrointestinal stromal tumor; C, cancer tissue; MARS, methionyl–tRNA synthetase; N, normal tissue.
Suppression of MARS inhibits the proliferation and migration capabilities of MCF-7 cells in vitro
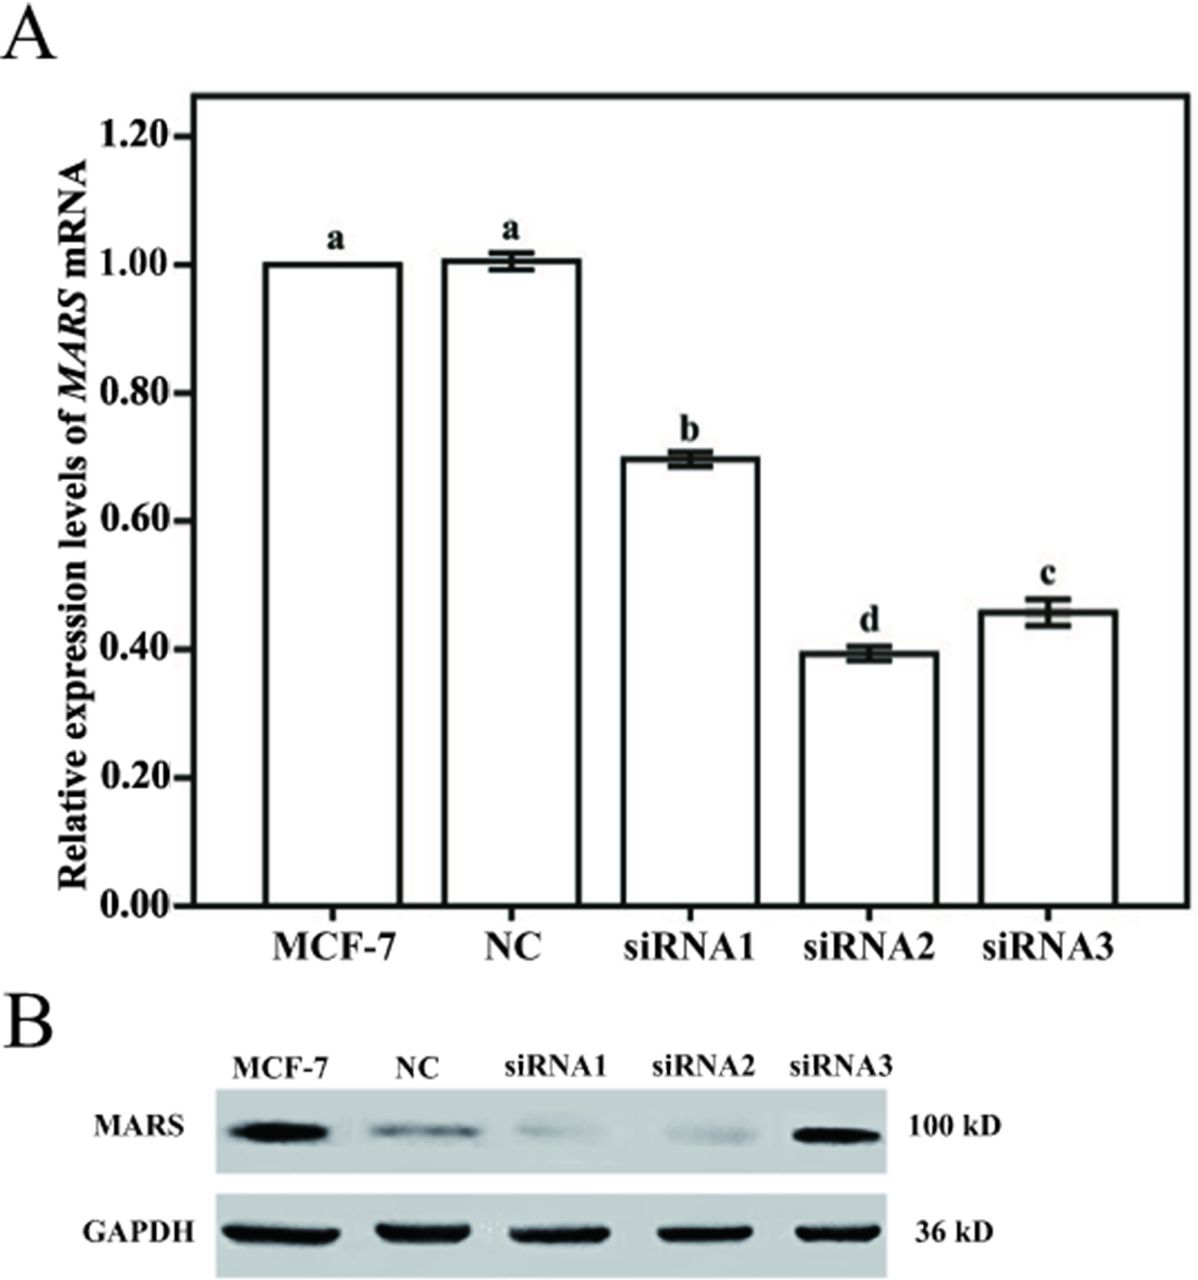
To further investigate the role of MARS in the proliferation and migration capabilities of BC cells, the expression level of MARS in MCF-7 cells was knocked down by transfection with three different sequences of MARS small interfering RNAs (siRNAs) (siRNA1, siRNA2 and siRNA3). The results showed that the MARS mRNA and protein levels were significantly decreased in MCF-7 cells after siRNA transfection, and the proliferation capability of MCF-7 cells was also decreased significantly (figure 8). Ultimately, siRNA2 was chosen as the best siRNA according to the decreased level of MARS expression and proliferation capability (figure 9).

Expression levels of MARS mRNA and protein in MCF-7 cells transfected with siRNA. (A) Expression levels of MARS mRNA in MCF-7 cells transfected with siRNA. (B) Expression levels of MARS protein in MCF-7 cells transfected with siRNA. Note: MCF-7 represents MCF-7 cells without any treatment. NC represents MCF-7 cells transfected with fam fluorescent group. siRNA1, 2 and 3 represent MCF-7 cells transfected with MARS-siRNA1, siRNA2 and siRNA3, respectively. Different letters indicate statistically significant differences between groups (p<0.05). MARS, methionyl–tRNA synthetase; MCF-7, human breast cancer cell line; mRNA, messenger RNA; NC, negative control; siRNA, small interfering RNA.
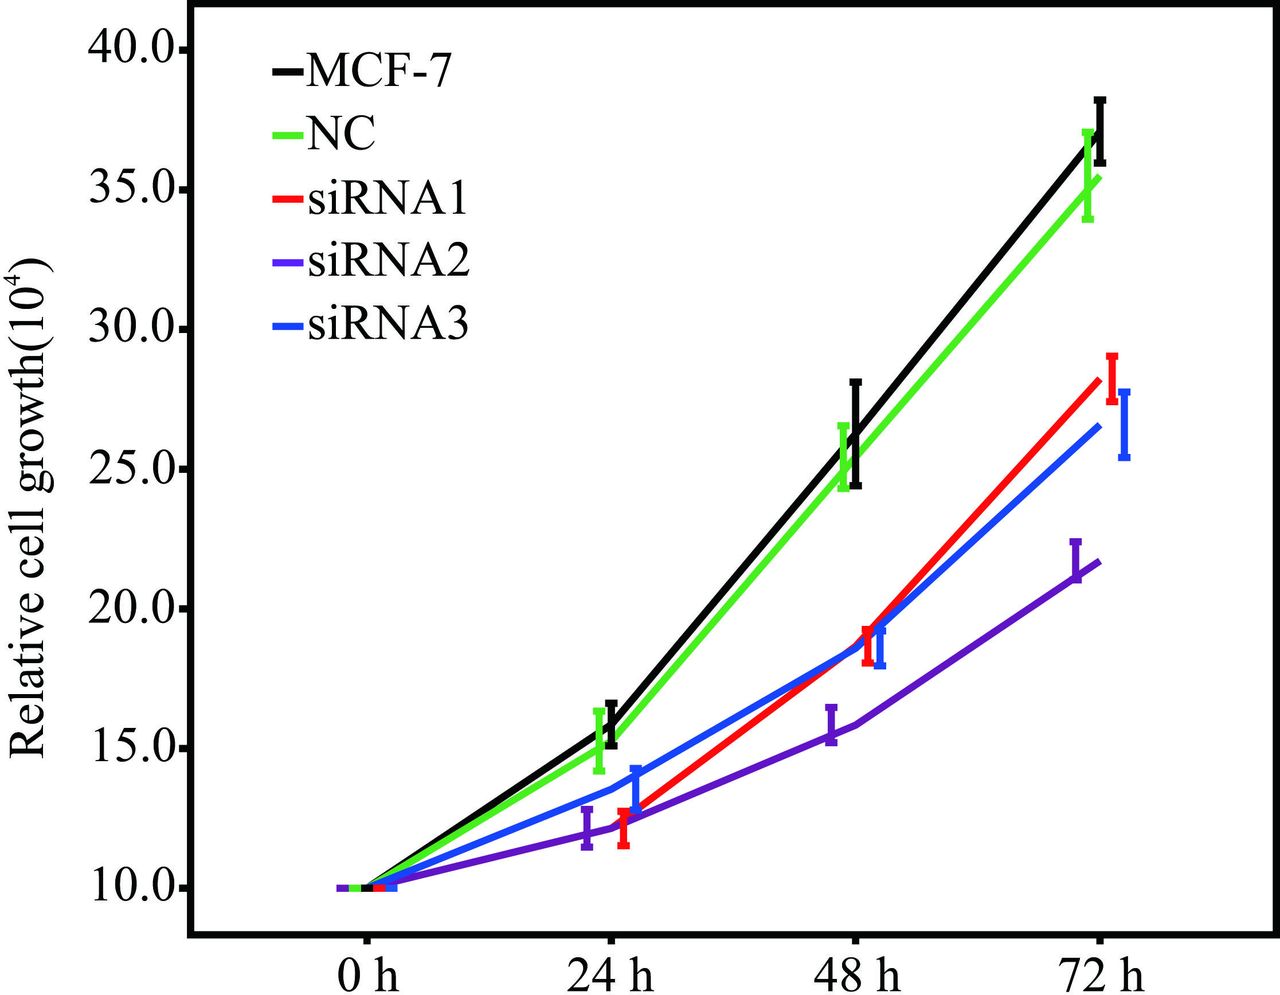
Growth of MCF-7 cells transfected with siRNA. Note: MCF-7 represents MCF-7 cells without any treatment. NC represents MCF-7 cells transfected with the fam fluorescent group. siRNA1, 2 and 3 represent MCF-7 cells transfected with MARS siRNA1, siRNA2 and siRNA3, respectively. MARS, methionyl–tRNA synthetase; MCF-7, human breast cancer cell line; NC, negative control; siRNA, small interfering RNA.
Next, the role of MARS expression in affecting the migration capability of BC cells was examined, and the results showed that the knockdown of MARS reduced the migration abilities of MCF-7 cells (figure 10).

Migration of MCF-7 cells transfected with siRNA. Note: MCF-7 represents MCF-7 cells without any treatments. NC represents MCF-7 cells transfected with the fam fluorescent group. siRNA2 represents MCF-7 cells transfected with MARS-siRNA2. Scale bar=500 µm. MARS, methionyl–tRNA synthetase; MCF-7, human breast cancer cell line; NC, negative control; siRNA, small interfering RNA.
MARS induces the EMT process in BC cells
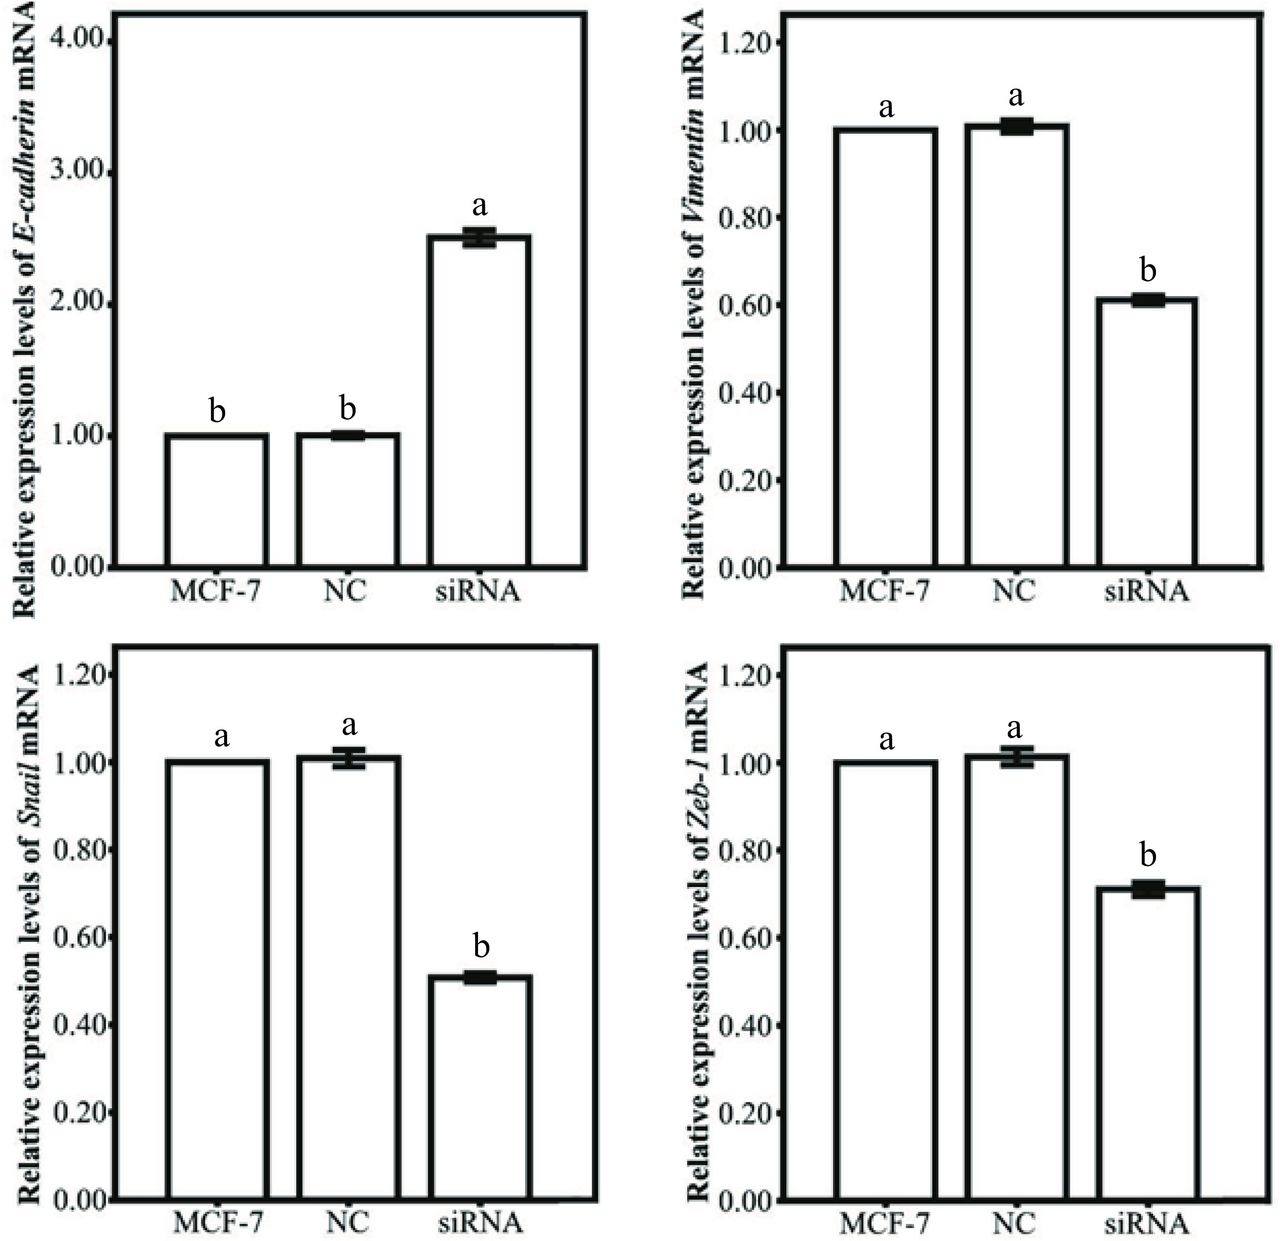
To analyse the mechanism of MARS expression in regulating the proliferative and migratory phenotype of MCF-7 cells, the specific markers of EMT process were detected by qRT-PCR. As shown in figure 11, the expression level of epithelial marker E-cadherin in MCF-7 cells was significantly upregulated after MARS knockdown, whereas the expression levels of these mesenchymal markers including Snail, Vimentin and ZEB-1 were significantly downregulated in MCF-7 cells, implying that MARS played an important role in the EMT process of BC cells.

Epithelial-to-mesenchymal transition gene expression patterns of MCF-7 cells transfected with siRNA. Note: MCF-7 represents MCF-7 cells without any treatment. NC represents MCF-7 cells transfected with the fam fluorescent group. siRNA represents MCF-7 cells transfected with MARS-siRNA2. Labelling with the same letter indicates absence of significant differences between the groups (p<0.05). MARS, methionyl–tRNA synthetase; MCF-7, human breast cancer cell line; mRNA, messenger RNA; NC, negative control; siRNA, small interfering RNA.
Discussion
Despite remarkable advances in early screening and detection of cancer over the past decades, advanced BC remains a threat to both premenopausal, perimenopausal and postmenopausal women globally due to the development of drug resistance in vivo,23 with potential tumour recurrence following the initial response.24
The current treatment targets to reduce the metastatic potentials of invasive BC cells mainly focus on the inhibition of the proliferation-related and invasion-related pathways, including cell cycle, apoptosis and mitosis through chemotherapy, radiotherapy and surgical interventions.23 25 26 However, the current therapeutic options for BC lack the ability to fully block the fundamental mechanism associated with cancer invasive disseminations. Therefore, targeting the processes underlying BC invasion and additional genetic targeted therapies may pose a superior strategy to inhibit the cancer recurrence without inducing further metastasis.
MARS, as one of the enzymes that have been the most extensively studied from bacteria to mammals, catalyses the fundamental process as initiation and elongation steps for protein translation.27 28 Besides the canonical roles as a translation initiator, MARS has multiple non-canonical functions, including activating the mammalian target of rapamycin complex 1 (mTORC1) signal pathway and stabilising cyclin-dependent kinase 4, thereby inducing cell cycle progression.16 Furthermore, with the strategies related to MARS-mediated mistranslations in vivo, mammalian cells survive under ROS-mediated stress by tolerating a reduced fidelity of translations. However, unbalanced misacylation could increase the potential of adverse effects on mammalian cells with the accumulation of misfolded or inactive proteins, which would further result in human diseases such as cancer or degenerative diseases.29 30 The specific correlations between unbalanced misacylation and cancer or degenerative diseases still need further exploration to uncover their relationship.
In humans, the C-terminal domain of MARS protein regulates the slow release of aminoacyl-tRNA in vivo and provides the limiting aminoacylation reactions.28 31 Furthermore, the C-terminal domain of MARS protein is also associated with the repeated motifs, which is initially discovered in the linker region of the bifunctional glutamyl-prolyl-tRNA synthetase.32 In mammals, MARS is one of the key components of a multisynthetase complex containing nine synthetases specific for amino acids as Glu, Pro, Ile, Leu, Met, Gln, Lys, Arg and Asp, as well as three auxiliary proteins.31 32 MARS has been reported to be overexpressed in NSCLC with poor clinical outcomes, and the expression of MARS was significantly associated with mTORC1 activities.16
In this study, the expression patterns of MARS in human BC tissues and adjacent tissues were assessed. It was found that both gene and protein levels were significantly increased in human BC tissues as compared with those in the adjacent tissues. Meanwhile, the high MARS protein expression level was significantly correlated with the poor OS of BC and other patients with cancer, suggesting that MARS could be applied as a potential clinical marker in predicting unfavourable prognosis of patients with BC.
Furthermore, the results of GEPIA datasets showed that the MARS expression level was positively correlated with poor OS of patients with ACC, KIRC, KIRP, LGG, LIHC, MESO, SARC and UVM cancers. Moreover, our data are consistent with the results of UALCAN database and GENT which further proved the role of MARS in BC progression. Furthermore, the UALCAN database about the relationship between the expression pattern of MARS and BC stage showed that there was no significant difference in MARS expression between stages 1, 2 and 4, which increases the application potential of MARS as a prognostic biomarker in BC with different stages.
In summary, we analysed the MARS mRNA and protein expression patterns in human BC tissues and found that MARS was involved in the progression of BC and several other kinds of cancers. The aforementioned results suggest that MARS acts as an oncogene in BC progression and may prove to be a potential prognostic biomarker for BC progression.
Take home messages
High methionyl–tRNA synthetase (MARS) expression and tumour, node, metastasis stage were independent predictors of poor prognosis for patients with BC.
High MARS expression was associated with unfavourable prognosis in patients with BC and could serve as a potential prognostic marker in clinical diagnosis and treatments of BC.
Knockdown of MARS expression in MCF-7 cells suppressed the proliferation, migration and EMT process of BC cells.
Acknowledgments
We thank the staff of the Department of Pathology, Affiliated Hospital of Nantong University, for their technical support.
References
Footnotes
Handling editor Cheok Soon Lee.
QJ, GL and BW contributed equally.
Contributors Data curation: QJ, BW and GL; formal analysis: QJ and GL; funding acquisition: YD; investigation: BW, QJ, GL and SL; methodology: QJ, CW and JR; project administration: SZ and YD; resources: QJ, SZ and KN; supervision: SZ and YD; writing of the original draft: QJ and GL; writing, review and editing: YD.
Competing interests None declared.
Patient consent for publication Not required.
Ethics approval The research protocol was approved by the ethics committee of the Affiliated Hospital of Nantong University (Jiangsu, China), and informed consent was obtained from all participating patients.
Provenance and peer review Not commissioned; externally peer reviewed.
Data availability statement All data relevant to the study are included in the article or uploaded as supplementary information. All data relevant to the study are included in the article or uploaded as supplementary information.