Article Text

Abstract
The lipid profile is important in the risk assessment for cardiovascular disease. The lipid profile includes total cholesterol, high-density lipoprotein (HDL)-cholesterol, triglycerides (TGs) and low-density lipoprotein (LDL)-cholesterol (LDL-C). LDL-C has traditionally been calculated using the Friedewald equation (invalid with TGs greater than 4.5 mmol/L and is based on the assumption that the ratio of TG to cholesterol in very- low-density lipoprotein (VLDL) is 5 when measured in mg /dL). LDL-C can be quantified with a reference method, beta-quantification involving ultracentrifugation and this is unsuitable for routine use. Direct measurement of LDL-C was expected to provide a solution with high TGs. However, this has some challenges because of a lack of standardisation between the reagents and assays from different manufacturers as well as the additional costs. Furthermore, mild hypertriglyceridaemia also distorts direct LDL-C measurements. With the limitations of the Friedewald equation, alternatives have been derived. Newer equations include the Sampson-National Institutes of Health (NIH) equation 2 and the Martin-Hopkins equation. The Sampson-NIH2 equation was derived using beta-quantification in a population with high TG and multiple least squares regression to calculate VLDL-C, using TGs and non-HDL-C as independent variables. These data were used in a second equation to calculate LDL-C. The Sampson-NIH2 equation can be used with TGs up to 9 mmol/L. The Martin-Hopkins equation uses a 180 cell stratification of TG/non-HDL-C to determine the TG:VLDL-C ratio and can be used with TGs up to 4.5 mmol/L. Recently, an extended Martin-Hopkins equation has become available for TGs up to 9.04 mmol/L.This article discusses the best practice approach to calculating LDL-C based on the available evidence.
- LIPOPROTEINS
- LIPIDS
- Hyperlipidemias
- CHEMISTRY
Statistics from Altmetric.com
Background
In 2019, cardiovascular disease (CVD) accounted for 32% of global deaths and elevated low-density lipoprotein (LDL) cholesterol was identified as a major risk factor.1 LDL-cholesterol (LDL-C) is also a major target in clinical practice guidelines for treatment on which CVD classifications and adjustments of treatment for elevated cholesterol are based. Accurate measurement is essential as treatment decisions are often based on achievement of a specific LDL-C goal, a risk-based treatment goal or a reduction in LDL cholesterol levels by at least 50%.2 These guidelines were however compiled from randomised controlled trials (RCTs) and other studies in which the Friedewald calculation was mainly used to determine LDL-C levels.3 How Friedewald compares to other methods of LDL-C needs to be borne in mind when making decisions about treatment adjustments based on LDL-C levels obtained by different methods. The strength of the recommendations in the guidelines is based on different levels of evidence on which the recommendations are based.4
The gold-standard reference method for measurement of LDL cholesterol is beta quantification.2 This combines ultracentrifugation and precipitation with polyanions to separate lipoproteins. There are several limitations to this method: it is not convenient for routine use, as it is expensive, labour intensive,requires a large number of sample batches and can only be done in specialised laboratories. The concept of calculating LDL cholesterol based on the lipid profile was developed a few decades ago by James Friedewald in 1972.5 He introduced a formula (referred to as the Friedewald formula or equation) that became widely adopted in practice and was based on the assumption that the ratio of triglycerides to cholesterol in very-low-density lipoprotein (VLDL) is a factor of 5.5
Plasma LDL cholesterol levels have been, for many years, indirectly determined by calculation from total cholesterol, high-density lipoprotein (HDL) cholesterol and plasma TG measurements based on the original Friedewald equation – LDL-C (mmol/L) = TC -HDL- TG/2.2. There was a factor applied by dividing TGs either by 2.2 (using mmol/ L) or 5 (mg/dL). Subsequently, there were a number of limitations that became apparent when using this calculation leading to continuous discussion and debate over the decades.
The equation assumes a fixed TG to cholesterol ratio for estimating the concentration of the VLDL cholesterol. With high levels of TGs, the relationship may not be valid.6 7 It requires fasting samples as the presence of chylomicronaemia leads to underestimation of VLDL-C and consequently overestimation of the LDL-cholesterol. It is not suitable for TG levels higher than 4.5 mmol/L and type 3 hyperlipidaemia.6 7 It also loses accuracy with TGs that are above 1.69 mmol/L (150 mg/dL), and with very low levels of LDL cholesterol, below the 1.8 mmol/L (70 mg/dL) target. With the use of proprotein convertase subtilisin/kexin type 9 (PCSK9) inhibitors, LDL cholesterol can be reduced to very low levels when added to a statin. A low LDL cholesterol concentration can affect the VLDL cholesterol estimation and this can lead to incorrect LDL cholesterol calculation results. If calculation underestimates LDL cholesterol, this may have severe clinical implications which can lead to suboptimal therapy or even misclassification of CVD risk.
The use of direct LDL-C measurement: shortcomings and limitations
There is the alternative option of measuring the LDL cholesterol directly (table 2).8 There are very good indications for doing this, for example, in patients with high TG levels, it is often recommended to use the direct chemical assays. It can also be used on postprandial samples that have high TGs. A study in 2009 had shown that in over 27 000 women, there was a lack of association of direct LDL-C with CVD events in non-fasting samples 9 implying that direct LDL-C may not be useful in nonfasting samples. Lately, there has been a move to non-fasting samples and avoidance of fasting samples for convenience. There is an issue of using different statins and the validity in using different methods of measuring LDL-C in these patients and it is therefore recommended that direct measurement of LDL-C might be more accurate in these situations.10 11
Direct assay of LDL cholesterol has also been shown to be more accurate than total cholesterol for lipoprotein screening. The main limitation to direct assay of LDL cholesterol is the lack of standardisation across laboratories. The performance varies across methods and reagents used.12 With mild hypertriglyceridaemia >4.5 mmol/L direct LDL assays become less reliable, potentially affecting CVD risk estimation and treatment decisions.12 Using direct LDL-C in patients with hypertriglyceridaemia has the potential to misclassify patients when using the SCORE (Systematic COronary Risk Evaluation) prediction model.13 There is also the concern of the clinical utility of non-fasting samples; direct LDL-C measurement is time-consuming and could be inaccurate in dyslipidaemia. Additionally, there are concerns about cost effectiveness when performing direct LDL cholesterols in all patients14 when in many instances, calculation may suffice. This leads to an increase in the cost of a total lipid profile when compared with the calculated LDL cholesterol which does not add any further costs to the total lipid profile. The direct measurement of LDL-C can add approximately 27% to the laboratory test leading to an increase in total costs for all laboratories, especially those running high volumes of these tests. The lipid profile is one of the most frequently ordered tests in clinical practice. In addition, time intervals between ordering these tests are inappropriate in many cases when compared with proposed guidelines.15
In terms of the choice of analyser, there may be variations in LDL-C results. Rossouw et al 16 compared the Abbott and Roche platforms and found that when using an Abbott analyser, the Martin/Hopkins, Friedewald and Sampson LDL-C were comparable, while on the Roche platform, the Martin/Hopkins was only comparable to the Friedewald and not to the Sampson LDL-C. Additionally, they found that in patients with LDL-C ≤1.8 mmol/L and TG ≤1.7 mmol/L, the predicted LDL-C between Martin/Hopkins, Friedewald and the Sampson equations were comparable when using Abbott reagents. However, these LDL-C values were not comparable when using Roche reagents. This data indicates that the analyser and reagent choice are additional variables that may affect LDL-C results.
Comparisons of the various formulae and equations
Several equations have been developed over the years, to overcome the limitations of the Friedewald equation since it was first reported (online supplemental table 1). In the original report of Friedewald,5 one of the limitations apparent was the fact that it was based on a very small sample size of 448 samples. In addition, most of the data used to derive the Friedewald equation was from a population with familial hypercholesterolaemia. Furthermore, there were specific exclusion criteria including non-fasted samples, TGs >4.5 mmol/L and LDL-C<1.8 mmol/L (online supplemental table 1). Therefore, these data do not represent the general population. The main calculated LDL formulae that have been developed and used are shown (online supplemental table 1). Some have been validated and derived from large studies.
Supplemental material
Several studies have also compared a combination of these different fequations in different populations or modifications of these formulae. These studies have taken several of these formulae and compared them in hospitalised patients,17 different ethnic populations18–20 populations with varied metabolic health status21 as well as adults22 and children.23 24
Martin/Hopkins equation versus Sampson-National Institutes of Health equation 2
In most of these studies cited above, the results indicated that the Friedewald equation was not the best equation to use in any of these populations. This begs the question: which equation would be the best one to use? This varies according to the different populations that were assessed. The newer equations that appear to be the most robust and useful appear to be the Martin/Hopkins25 and the Sampson (National Institutes of Health, NIH equation 2) formula.26 The Martin-Hopkins equation uses patient-specific ratios of TGs to LDL cholesterol and it is based on a stratified 180 cell table, which uses a specific ratio based on the level of TGs and non-HDL-C in the equation. The Sampson equation uses TGs and a non- HDL independent variable in a least squares regression; it then generates VLDL cholesterol, which is used in a second equation to calculate LDL cholesterol at both low LDL-C and/or high TG levels. These two values are central in deciding which is accurate to use for CVD risk assessment and treatment adjustments. A study published in JAMA Cardiology indicates that the Sampson equation may underestimate LDL-C at low levels when compared with ultracentrifugation.27 This may be due to the equation being derived using a sample population with few individuals having low LDL-C levels.
The Martin-Hopkins equation uses an adjustable factor for the TG-VLDL cholesterol ratio, has been validated on a large data set and was shown to provide more accurate LDL cholesterol results than the Friedewald equation. This was especially the case when LDL was very low(below 1.81 mmol/L) and in those with elevated TG levels. Improved classification of patients on lipid lowering therapies was also found including those on PCSK9 inhibitors28 and with low LDL cholesterol levels, whether the patient was on statins or for other reasons. The 180-cell Martin-Hopkins equation underestimates the VLDL-C in patients with high TG levels. The Martin-Hopkins equation is currently not in widespread use because of the need for further validation and the complexity of implementing the 180 cell stratification in a laboratory information system. A recent study focused on the validation of the Friedewald, Sampson and the Martin Hopkins formula in an adult Turkish population.29 Additional validation in different population groups will provide more information about the clinical utility of these formulas in assessing CVD risk.
The Sampson equation, developed in 2020, was formulated in patients where the TG levels were up to 9 mmol/L or 800 mg/dL. It was based on beta-quantification and a dataset with high TG and the equation is freely available online. Although the calculation appears complex, it is a single equation that can be easily integrated into any existing laboratory information system and this makes it more practical to use in existing laboratories. Clinicians can report LDL cholesterol levels for patients with hypertriglyceridaemia at very high levels (TG<9 mmol/L; 800 mg/dL) and also estimate LDL cholesterol levels for patients with normolipidaemia and/or low levels of LDL cholesterol which can be the same as or more accurate than the other existing equations. (We have also been able to adapt the Martin-Hopkins equation for use in laboratory information systems using mmol/L).
A recent study by Ginsberg et al,2 examined the Friedewald, Martin-Hopkins and Sampson equations vs beta quantification in pooled trials of patients on PCSK9 inhibitors. The authors examined the concordance between calculated and beta quantification-derived LDL- C calculated values, above or below the LDL-C threshold of the 1.8 mmol/L (70 mg/dL) cut-off, which was used for patients in very high CV risk categories (table 1).
Analysis of concordance between calculated and BQ derived LDL-C values for the LDL-C threshold of 70 mg/dL (1.81 mmol/L)2
This shows that for beta quantification-derived LDL cholesterol values, especially the low ones, the concordance was 94.7% (Friedewald), 97.4% (Martin-Hopkins) and 96.9% (Sampson). When TG levels were less than 4 mmol/L (150 mg/dL), the difference appeared to be minimal, regardless of the LDL-C level. When the TG levels were above 4 mmol/L (150 mg/dL), the Sampson equation had the greatest accuracy. At TG levels above 6 mmol/L (250 mg/dL), all three methods showed inaccuracies although the Sampson equation was still the most accurate.
The discrepancies between the three formulae and beta quantification of LDL-C are clinically insignificant when TGs are between 70 and 150 mg/dL (0.8–1.7 mmol/L).2 Above this level, there are differences in performance with Sampson performing better than the 180 cell Martin-Hopkins equation and this could be clinically relevant.2 More than 50% of the LDL-C results differed by less than (0.13 mmol/L) (5 mg/dL), including those in the lowest quantile of the LDL cholesterol results. The authors concluded that LDL cholesterol, by any method, can calculate treatment decisions in most patients, including those on lipid-lowering therapies and PCSK9 inhibitors.2 Insights into the FOURIER trial published in JAMA Cardiology reveal that the Martin-Hopkins equation outperformed the Friedewald equation in patients treated with PCSK-9 inhibitors when compared with the preparative ultracentrifugation reference method.30 Although the Sampson equation was not included in this study, it has been shown to lose accuracy at low LDL-C levels27 and therefore may not be ideal to use in patients on lipid lowering therapies.
A recent study by Steyn et al 31 compared direct measurement of LDL-C using direct LDL enzymatic assays to the Sampson, Martin/Hopkins, Friedewald, Hattori and Anandaraja equations in a paediatric population (N=7598) and an adult population with uncontrolled diabetes (N=57 165). This study indicated that the Martin/Hopkins formula may be used in place of direct LDL enzymatic assays in these two populations as this equation is the least likely to underestimate CV risk when compared with the other four formulas.
Current international guidelines
Clinical practice guidelines remain the main device for delivering evidence-based recommendations but may contain gaps when there is ambiguity on certain aspects of a topic. Differences between guideline recommendations exist, with some focused on specific LDL-C treatment targets, others on percent reduction of LDL-C, and yet others on intensity of treatment and patient risk.32 The variance in recommendations indicates a lack of consistency in available evidence.3
The European Society of Cardiology (ESC)/European Atherosclerosis Society (EAS) guidelines are based on intervention strategies as a function of total CV risk and LDL-C level derived from evidence from multiple meta-analyses and RCTs as well as other sources that demonstrated consistent graded reduction in CVD risk when LDL-C is reduced—the higher the initial LDL-C level the greater the absolute risk reduction while the relative risk reduction was constant at any initial level.33 The US expert panel confined itself to a simple, hard source of evidence coming from results in RCTs. There has been no RCT to support the American Heart Association (AHA)/American College of Cardiology (ACC) recommendation for the use of high-dose statins in all high-risk people regardless of baseline LDL-C level33 or large RCTs to evaluate the outcome of drug titration to specific LDL-C targets.3 Importantly, the majority of RCTs on which guidelines have been based used the Friedewald calculation to evaluate LDL-C levels.3 33 Statin trial data suggest that the absolute benefits of treatment are related to an individual’s risk of atherosclerotic CVD and the absolute reduction in LDLC that is achieved.34 No level of LDL-C below which benefit ceases or harm occurs has been defined for patients with CVD or cerebrovascular disease.33–35 A meta-analysis of statin trials indicated that individuals achieving LDL-C levels <50 mg/dL (1.3 mmol/L) with statin therapy had a lower risk of major CV events, but possibly a slightly higher risk of haemorrhagic stroke (although absolute event rate was low).36 Prolonged exposure to very low levels of LDL-C levels in patients with genetic conditions causing physiologically low levels of this type of cholesterol has not been associated with any adverse events, providing reassurance that very low LDL-C levels may have an acceptable safety profile.36
Possible risks, increased patient burden and costs associated with pursuing these low target levels have not been adequately addressed in the literature and this could result in the promotion of unsafe treatment recommendations focusing solely on the achievement of a specific target LDL-C.37 Even when maximal dosages of high-intensity statins are used concurrently with ezetimibe, around 50% of patients would qualify for PCSK9 inhibitor adjunctive therapy postmyocardial infarction according to the 2019 ESC/EAS guidelines,38 which would have significant financial implications. Furthermore genetic studies propose that CV risk is associated not just with the absolute concentration of LDL-C but also with the duration of exposure.36
The AHA/ACC committee recommends that the thresholds for consideration of net CVD risk-reduction benefit should merely be considerations and not firm triggers for intensification of therapy because of the uncertainty associated with different methods of LDL-C measurement. However, specific LDL-C targets have been incorporated in the most recent consensus document from the ACC expert panel.3 34 Treatment targets will produce greater benefit for patients with high baseline LDL-C values, but may mean that people with lower initial levels, if treated to a target LDL-C with the low doses of statin required for this, will not receive the benefit that they might from higher fixed dose statin treatment.34
Observational data on the attainment of current recommended low LDL-C goals in real-world practice will be an important piece of evidence to validate the proposed thresholds and perhaps support further alignment of LDL-C treatment goals as well as LDL-C measurement practices worldwide.39
In 2018, before the Sampson equation was released, the ACC and AHA guidelines4 recommended the Martin/Hopkins formula as the preferred calculation method for patients with low LDL cholesterol. The original 180 cell Martin-Hopkins equation splits the TGs into categories, but was only validated for TG levels below 4.5 mmol/L (400 mg/dL), and laboratories do not report LDL cholesterol levels when the TGs are greater than 4.5 mmol/ L (400 mg/dL). The European guidelines recommend that the Friedewald equation- calculated LDL cholesterol provides reasonable estimation of the beta quantification-derived LDL cholesterol in most cases for example, when the TG concentration was less than the 4.5 mmol/L (400 mg/dL).40 However, when TG levels are very high (<9 mmol/L, 800 mg/dL), the Sampson or extended Martin/Hopkins equation can be used or LDL cholesterol levels can be measured directly. Therefore, there are three options in that clinical scenario (figure 1). The clinical benefits of estimating LDL-C relate to the estimation of CV risk. LDL-C and other apoB-containing lipoproteins are considered by the ESC, ACC, AHA and EAS to be the main focus of lipid-lowering interventions.41–45
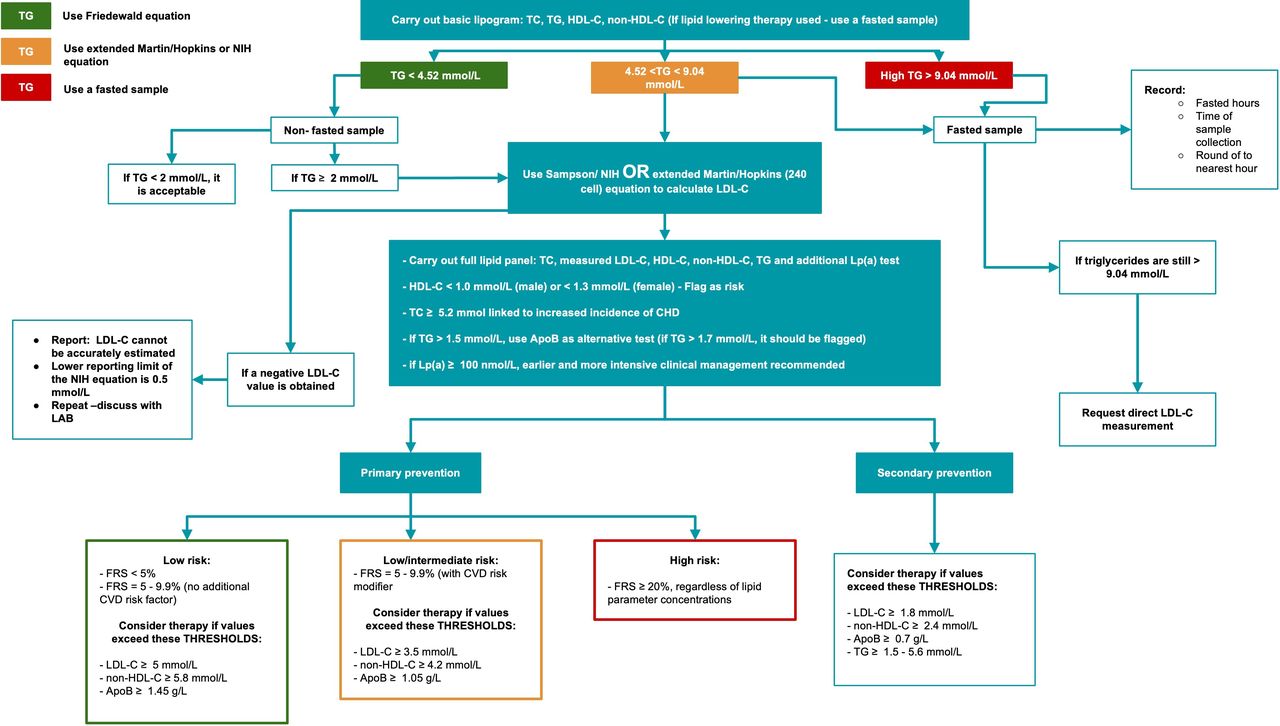
Cardiovascular risk status algorithm based on lipid parameter concentrations and Framingham risk scores. The algorithm begins with carrying out a basic lipid profile to determine the level of triglycerides in the sample. At TG levels lower than 4.52 mmol/L, the Friedewald equation can be used to calculate LDL-C. At TG levels between 4.52 and 9.04 mmol/L, the extended Martin/Hopkins equation or the Sampson equation is recommended to calculate LDL-C. Fasted samples are recommended for intermediate to high TG levels (4.52 - 9.04 mmol/L), while non-fasted samples can be used when TG < 4.52 mmol/L. If fasted samples produce TG levels above 9.04 mmol/L, report, ‘LDL-C cannot be accurately estimated’. Threshold lipid values are included for LDL-C, non-HDL-C and ApoB in primary intervention for low, intermediate and high risk categories. If a patient’s lipid results exceed these values, therapy should be considered. Apo B, apolipoprotein B; FRS, Framingham Risk Score; HDL, high-density lipoprotein; LDL, low-density lipoprotein; Lp(a), lipoprotein (a); TG, triglycerides.
The guidelines do not clearly indicate a benefit to using the direct LDL cholesterol method over the Friedewald equation in routine use, but as an alternative they do recommend non- HDL cholesterol and apolipoprotein B to estimate CV risk.40 When comparing reductions in apoB, non-HDL-C and LDL-C, it was found that the reduction in apoB had the strongest correlation to risk reduction produced by statin therapy.46 47 Additionally, the risk of myocardial infarction was also correlated more closely with levels of apoB compared with non-HDL-C and LDL-C, indicating that this marker may be of significant use when assessing risk status.48 The current guidelines are still applicable. In 2018, US Cholesterol management guidelines advocated for the use of the Martin/Hopkins equation for LDL cholesterol levels less than 1.81 mmol/L (70 mg/dL).4 In 2019, the AHA guidelines advocated for the use of alternative calculations or use of direct LDL cholesterol measurement but did not see this as superior to the Friedewald calculation.49 They did, however, acknowledge the limitations of the Friedewald calculation.
The 2020 and 2021 guidelines of the AHA recommend that decision making should include the patient’s 10-year risk for CV risk, according to the Pooled Cohort equations and this should include the risk enhancing factors. Using statins as the foundation towards other lipid-lowering treatments can be added and there should be special adjustment of the algorithms for ethnic groups, adults with chronic kidney disease, particularly those with HIV and women.50 A significant point to take into consideration is that many 10-year risk calculations do not use LDL-C or TGs.
We looked at various studies that compared the various formulae/equations to direct LDL cholesterol measurement specifically spanning the period of 2020 until 2022, and we found 39 studies that looked at various groups (summarised in table 2).51 It is significant to note that 22 of these studies used enzymatic assays as the direct method for LDL-C calculation, 2 studies used beta quantification, 1 study used vertical auto profile ultracentrifugation, 5 studies did not specify the direct method used and direct assays were not applicable in the remaining 9 studies as they compared LDL-C equations to each other.
Adaptation of established and novel markers to measure LDL-cholesterol8
The performance of the equations varies depending on the patient cohort. It is interesting that novel machine learning models are being developed for different populations52 53 and formulae appear to be population specific in terms of their performance.17 23 54 55 Another concern highlighted by various authors was the variation in performance of the equations when combined with other CV risk markers in patients, for example, apo B, Lp(a),56 small dense LDL,57 non-HDL-C/TG ratio,58 non-HDL-C in CVD,59 high HDL-C60 and apoE genotypes.61
There is one study that applied a correction in the Friedewald equation to change the estimation with risk of Lp(a), but that still needs to be validated.56 The actual LDL cholesterol particle is made up of free cholesterol, sphingomyelin, cholesterol esters internally and TGs internally, but of importance is how this particle is compacted (density, size, amount of TG, external surface molecules). The diameter of the LDL particle is approximately 19–22 nm and the average density is between 1.019 and 1.063 g/mL. The core contains TGs and cholesteryl esters while phospholipids, free cholesterol and apoB-100 are found on the surface.8 All of these are important parameters and are the subject of continuing investigation. Other LDL-based tests show superiority to the calculated or the direct LDL cholesterol levels and these include LDL-TG, small dense LDL, LDL-sphingomyelin (LDL-SM), which has the propensity for LDL to aggregate in the pathogenesis for atherosclerosis and also the LDL particle number.8 The ACC and AHA guidelines advocate for: (A) the use of the Friedewald equation with its acknowledged limitations, the original Martin-Hopkins equation recommened for use on fasting samples and (B) the Sampson equation that performs very well on high TG levels and low LDL cholesterol levels, in patients on lipid lowering therapies and can be used in non-fasting samples.4 49 All of these are in the current guidelines in terms of being applicable but should be on a case by case basis for the patient. Direct LDL-C measurement can be used, although it is less accurate for some lipidaemic samples and there are also cost implications.14
The 2021 recommendation of the Canadian Society of Clinical Chemists recommends the use of the Sampson-NIH2 equation in place of the Friedewald equation for calculating LDL-C in all patients.62 The laboratory report should explicitly state which equation was used if the calculated LDL-C result is reported. If the TG>4.52 mmol/L and the LDL-C result was calculated using the Friedewald equation, the LDL-C result should be cancelled with a comment on the report that the TGs exceed 4.52 mmol/L. In this instance, non-HDL-C can be calculated or the samples should be recollected in a fasting state and measurement of apoB should be undertaken. If the Sampson NIH-2 equation has been used and the TG>9.04 mmol/L, the the LDL-C result should be cancelled with a comment on the report that the TGs exceed 9.04 mmol/L and samples should be recollected in a fasting state or calculation of non-HDL-C or measurement of apoB should be undertaken. If a negative LDL-C value is calculated then the reporting comment should be included an indication that the LDL-C is too low to be accurately estimated. The Sampson- NIH2 equation should have a lower reporting limit of 0.50 mmol/L. The Sampson-NIH2 equation was originally configured to work in conventional units (mg/dL). The formula can be converted to work in SI units and there is a published version.63 For samples with high TGs, there is also the option of using the extended Martin-Hopkins equation64 which has an additional 240 cell stratification to cover TG values up to 9.04 mmol/L. However, this requires additional mathematical analysis of the results, which may present a challenge to laboratories but is possible using automated spreadsheets.
It is debatable as to whether the most accurate measurement tool or the measurement tool used to generate the target values recommended by the guidelines is best to use. The guidelines each have their own recommendations as to which method to use as outlined above.
Many of the RCTs that the guideline targets are based on utilised the Friedewald calculation,3 36 but as more RCT’s are done in the era that newer equations and direct measurements are available, these are likely to be used in more trials.
When the Friedewald equation was introduced lower LDL-C levels were not achievable or strongly recommended and hypertriglyceridaemia was not as prevalent as it is today. With current increasing prevalence of conditions such as obesity and diabetes leading to increased TG levels and new treatment modalities achieving extremely low LDL-C levels, underestimation of these levels by the Friedewald equation may lead to undertreatment of high-risk patients. This is arguably more clinically relevant than overtreatment. The extended Martin/Hopkins equation is least likely to underestimate LDL-C and the Sampson equation falls in between Friedewald and the extended Martin/Hopkins.65 Direct LDL-C measurement is still highly recommended at TG levels ≥400 mg/dL by most guidelines.3 38 65
Constant vigilance about redefining our estimation methods is necessary as therapeutic targets evolve and new medications become available, as evidence-based contemporary tools to achieve precision care is the cornerstone of modern medicine.
Other LDL-based tests
In a recent cohort study by Marston et al,48 association with MI was best captured by the number of apoB-containing lipoproteins, independent from lipid content (cholesterol or TG) or type of lipoprotein (LDL or TG-rich). This suggests that apoB may be the primary driver of atherosclerosis and that lowering the overall concentration of all apoB-containing lipoproteins should be the focus of therapeutic strategies.
A meta-analysis of seven major RCTs in 2014 concluded that relative coronary heart disease risk reduction was more closely related to reductions in apoB than to reductions in either non-HDL-C or LDL-C.46 ApoB has also been shown to be superior to LDL-C and non-HDL-C for predicting CV events and as the most informative marker on the benefit of statin therapy.46 ,48 However, current guidelines still advocate for the use of LDL-C as both primary screening for risk and treatment goal, and it is still the most used tool for CVD risk assessment in clinical trials. Therefore, the estimation of LDL-C is currently still recommended for assessing patients for CVD risk and for monitoring treatment in clinical practice with non-HDL and apoB only being used as alternatives in specific cases where LDL-C by calculation or direct measurement is likely inaccurate.3 4 40 In future it is likely that the assessment of both non-HDL-C and apoB together with other lipid parameters will be recommended to provide a more complete lipid profile and allow identification of patients that could be misclassified if only classified based on their LDL-C levels.
The other newer markers are listed in table 2. The only one that is U.S. Food and Drug Administration (FDA) approved is the direct small dense LDL cholesterol marker. It was previously a complex analyte to measure, but with the new homogeneous enzyme assay, it has become very easy to implement. However, it is not yet widely available and this is a current limitation.
Conclusion
In summary, the performance of LDL cholesterol is influenced by the choice in analyser, the lipid levels (total cholesterol, LDL cholesterol, TG), fasting versus non-fasting samples, the clinical setting and patient profiles, and lipid-lowering therapies including statins and PCSK-9 inhibitors. Furthermore, when TG levels are very high, in this context more than 4.52 mmol/L (175 mg/dL), the Sampson equation shows the greatest accuracy versus Martin-Hopkins and the Friedewald equation, but the recently developed extended Martin-Hopkins equation exhibits significantly improved accuracy in hypertriglyceridaemia with less tendency for underestimation of risk in low LDL-C44. Measurement of direct LDL cholesterol for CVD risk reflection should be done when the LDL-C calculation might be unreliable, as in cases where the fasting TG levels remain markedly increased (>9.04 mmol/L) (see figure 1 for algorithm).
Ethics statements
Patient consent for publication
References
Supplementary materials
Supplementary Data
This web only file has been produced by the BMJ Publishing Group from an electronic file supplied by the author(s) and has not been edited for content.
Footnotes
Handling editor Patrick J Twomey.
Contributors The paper was conceptualised and written by JM and TSP. The paper was reviewed and edited by MR and NS. All authors have read and agreed to the published version manuscript. TSP accepts full responsibility for the finished work and/or the conduct of the study, has access to the data and controlled the decision to publish.
Funding National Research Foundation, South Africa. National Health Laboratory Service, South Africa.
Competing interests None declared.
Provenance and peer review Commissioned; externally peer reviewed.
Supplemental material This content has been supplied by the author(s). It has not been vetted by BMJ Publishing Group Limited (BMJ) and may not have been peer-reviewed. Any opinions or recommendations discussed are solely those of the author(s) and are not endorsed by BMJ. BMJ disclaims all liability and responsibility arising from any reliance placed on the content. Where the content includes any translated material, BMJ does not warrant the accuracy and reliability of the translations (including but not limited to local regulations, clinical guidelines, terminology, drug names and drug dosages), and is not responsible for any error and/or omissions arising from translation and adaptation or otherwise.