


Abstract
The monoclonal antibodies panitumumab and cetuximab that target the epidermal growth factor receptor (EGFR) have expanded the range of treatment options for metastatic colorectal cancer. Initial evaluation of these agents as monotherapy in patients with EGFR-expressing chemotherapy-refractory tumors yielded response rates of approximately 10%. The realization that detection of positive EGFR expression by immunostaining does not reliably predict clinical outcome of EGFR-targeted treatment has led to an intense search for alternative predictive biomarkers. Oncogenic activation of signaling pathways downstream of the EGFR, such as mutation of KRAS, BRAF, or PIK3CA oncogenes, or inactivation of the PTEN tumor suppressor gene is central to the progression of colorectal cancer. Tumor KRAS mutations, which may be present in 35%–45% of patients with colorectal cancer, have emerged as an important predictive marker of resistance to panitumumab or cetuximab treatment. In addition, among colorectal tumors carrying wild-type KRAS, mutation of BRAF or PIK3CA or loss of PTEN expression may be associated with resistance to EGFR-targeted monoclonal antibody treatment, although these additional biomarkers require further validation before incorporation into clinical practice. Additional knowledge of the molecular basis for sensitivity or resistance to EGFR-targeted monoclonal antibodies will allow the development of new treatment algorithms to identify patients who are most likely to respond to treatment and could also provide rationale for combining therapies to overcome primary resistance. The use of KRAS mutations as a selection biomarker for anti-EGFR monoclonal antibody (eg, panitumumab or cetuximab) treatment is the first major step toward individualized treatment for patients with metastatic colorectal cancer.
The epidermal growth factor receptor (EGFR), a member of the human epidermal growth factor receptor (HER)–erbB family of receptor tyrosine kinases, represents an important target for cancer treatment because its activation stimulates key processes involved in tumor growth and progression, including proliferation, angiogenesis, invasion, and metastasis. The binding of EGF or other ligands to EGFR initiates a mitogenic signaling cascade via several pathways, including the RAS–RAF–mitogen-activated protein kinase (MAPK), phosphatidylinositol 3-kinase (PI3K)–Akt, and phospholipase Cγ pathways (1,2). Overexpression of EGFR is found in a range of solid tumor types and has been linked to poorer outcomes (3,4).
EGFR inhibitors—monoclonal antibodies targeting the extracellular domain and small-molecule tyrosine kinase inhibitors—have expanded the range of treatment options for various solid tumors. EGFR-targeted monoclonal antibodies have been extensively studied in metastatic colorectal cancer (Table 1), whereas tyrosine kinase inhibitors have thus far shown little activity in this setting (5,6). Cetuximab (ER-K0034, Erbitux, Merck-Serono KgaA, Darmstadt, Germany; ImClone Systems Inc, New York, NY), the first anti-EGFR monoclonal antibody to be approved for clinical use for metastatic colorectal cancer, is a chimeric mouse–human monoclonal antibody that has been evaluated primarily in combination with chemotherapy (7–10) but also as monotherapy (7,11,12). Panitumumab (ABX-EGF, Vectibix; Amgen Inc, Thousand Oaks, CA), a fully human monoclonal antibody, has shown efficacy as monotherapy in chemotherapy-refractory patients with metastatic colorectal cancer (13), and ongoing chemotherapy combination trials in earlier lines of treatment have reported acceptable interim safety data (14,15). In addition, cetuximab and panitumumab have both been evaluated in combination with bevacizumab, a monoclonal antibody targeting the vascular endothelial growth factor (VEGF), plus standard first-line chemotherapy (16,17). However, increased toxicity and a shorter progression-free interval were observed in the experimental groups compared with the control groups. Thus, the strategy of combining both an EGFR inhibitor and a VEGF inhibitor with chemotherapy appears to be detrimental and is not being pursued further.
Anti–epidermal growth factor receptor (EGFR) monoclonal antibodies (mAbs) used for treatment of metastatic colorectal cancer (mCRC)
| Agent | Description | Company | Approved indications | Investigational indications |
| Cetuximab (Erbitux) | Chimeric mAb | Merck-Serono KGaA, Darmstadt, Germany; ImClone Systems Inc, New York, NY | Treatment of patients with EGFR-expressing, KRAS wild-type mCRC in combination with chemotherapy (EU) or irinotecan in irinotecan-refractory disease (US) or as a single agent in patients who have failed oxaliplatin- and irinotecan-based therapy or who are intolerant to irinotecan (EU, US) | In combination with other targeted agents |
| Panitumumab (Vectibix) | Fully human mAb | Amgen Inc, Thousand Oaks, CA | Monotherapy for fluoropyrimidine-, oxaliplatin-, and irinotecan-resistant EGFR-expressing mCRC with wild-type KRAS | In combination with chemotherapy and/or other targeted agents |
Cetuximab and panitumumab appear to have similar efficacy, achieving fairly modest but clinically meaningful objective response rates of approximately 10% when used as monotherapy for chemotherapy-refractory EGFR-expressing metastatic colorectal cancers (7,11–13,18). However, panitumumab is likely to be less immunogenic than cetuximab because of its fully human composition and, indeed, panitumumab seldom gives rise to severe infusion reactions (13). Such events may occur in up to 22% of cetuximab-treated patients, depending on geographical region (19,20), and appear to be commonly associated with preexisting specific IgE antibodies against the oligosaccharide component of the cetuximab molecule, galactose-α-1,3-galactose (21).
Positive EGFR protein expression, as determined by immunohistochemistry, was initially selected as an entry criterion for studies evaluating EGFR inhibitors on the assumption that sensitivity to such agents was associated with EGFR expression. However, a large body of evidence from patients who were treated with monoclonal antibodies for metastatic colorectal cancer (7,11,13,22,23) or tyrosine kinase inhibitors for other solid tumors (24,25) indicates that this biomarker is poorly associated with response to EGFR inhibitors in the clinical setting. Objective responses have been observed in patients with low or negative, as well as high, EGFR protein expression, as determined by immunohistochemistry. These findings have led to intense research to identify alternative predictive molecular biomarkers that can be used to identify patients who are most likely to benefit from EGFR-targeted treatment. This review discusses progress made toward these ends with a focus on treatment of metastatic colorectal cancer with anti-EGFR monoclonal antibodies.
Literature was identified in PubMed and oncology conference databases by use of the search terms “colorectal cancer” and “molecular markers” and retrieved articles were evaluated by the authors. All fully published clinical data relating to clinical response to treatment with monoclonal antibodies in metastatic colorectal cancer were considered for inclusion, as well as key conference abstracts. Additional searches of the same databases were performed to identify suitable background information.
Predicting Response: Molecular Biomarkers
Early work exploring molecular biomarkers of response to EGFR-targeted monoclonal antibodies (ie, cetuximab or panitumumab) as alternatives to EGFR protein determined by immunohistochemistry started in 2005 (26) and was based on retrospective analyses of archived tumor tissue from subsets of patients participating in clinical trials. However, more recently studies have been designed to incorporate biomarker analysis (eg, the pivotal phase III panitumumab study) (13,27). In general, primary tumor tissue was analyzed, although metastatic tissue was evaluated in some instances. In the majority of studies, cetuximab was given in combination with chemotherapy, which could make interpretation difficult, whereas to date, panitumumab has been administered almost exclusively as monotherapy. Although most biomarker datasets are from chemotherapy-refractory or relapsed patients who had received multiple previous lines of treatment, first-line data have recently been presented (28,29). Finally, it should also be mentioned that many analyses were based on objective responses alone, without taking disease stabilization into account.
Markers Downstream of EGFR
A rapidly growing body of knowledge has indicated that growth of many tumors is driven by constitutive activation of signaling pathways downstream of the EGFR, as will be discussed below. Figure 1 shows the interactions between various signaling pathways involved in tumor proliferation and progression. Such close interactions between these pathways may provide “escape mechanisms” that allow tumors to circumvent a pathway that has been pharmacologically blocked.
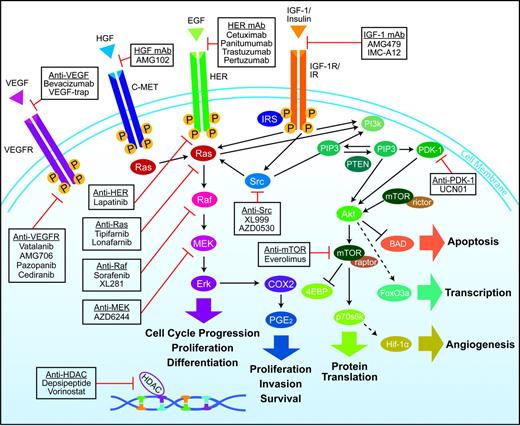
Overview of interlinked cellular signaling pathways involved in the proliferation and progression of colorectal cancer. Agents targeting signaling proteins that have been evaluated or are currently being evaluated in phase II, III, or IV clinical trials for colorectal cancer are shown. The epidermal growth factor receptor (EGFR)–related family of receptor tyrosine kinases includes human epidermal growth factor receptor (HER1), EGFR, or c-erbB1; HER2 or c-erbB2; HER3 or c-erbB3; and HER4 or c-erbB4. C-MET = mesenchymal–epithelial transition factor; EGF = epidermal growth factor; HDAC = histone deacetylases; HGF = hepatocyte growth factor; IGF-1 = insulin-like growth factor-I; IGF-1R = insulin-like growth factor-I receptor; IR = insulin receptor; VEGF = vascular endothelial growth factor; VEGF-R = vascular endothelial growth factor receptor.
The interlinked RAS–MAPK and PI3K signaling pathways (Figure 1) play an important role in tumorigenesis via phosphorylation of various proteins and transcription factors that directly control cell growth, differentiation, and apoptosis (1,2,30). KRAS, a member of the rat sarcoma virus (ras) gene family of oncogenes (including KRAS, HRAS, and NRAS), encodes the guanosine diphosphate (GDP)– and guanosine triphosphate (GTP)–binding protein RAS that acts as a self-inactivating intracellular signal transducer (31). After binding and activation by GTP, RAS recruits the oncogene RAF, which phosphorylates MAP2K (mitogen-activated protein kinase kinase)-1 and MAP2K-2, thus initiating MAPK signaling that ultimately leads to expression of proteins playing important roles in cell growth, differentiation, and survival. The oncogene PIK3CA encodes the p110 subunit of PI3K, which can be activated via interaction with RAS proteins (1,2,30).
Mutation in KRAS, BRAF, or PIK3CA results in continuous activation of the downstream RAS–MAPK or PI3K pathways, regardless of whether the EGFR is activated or pharmacologically blocked. Such activation in turn enhances transcription of various oncogenes, including MYC, CREB, and the gene for nuclear factor κB (1,2,30).
A recent population-based study of 586 patients with colon adenocarcinomas found mutations in KRAS, BRAF, and/or PIK3CA in 316 (56%) of the 586 tumors studied (32). KRAS is the most commonly mutated gene in this pathway, with mutations in 35%–45% of colorectal adenocarcinomas; mutations in PIK3CA (≤20%) and BRAF (<15%) are less common (32–37). Mutations in PIK3CA and KRAS or BRAF may coexist within the same tumor (32,36–38), but KRAS and BRAF mutations appear to be mutually exclusive (33,34,39–41). KRAS mutation is thought to be an early event in tumorigenesis (42,43), and, in general, metastatic and primary sites have been concordant with regard to KRAS status (44–46), with only small differences having been reported (47,48). KRAS mutations have been explored as prognostic biomarkers (independent of anti-EGFR monoclonal antibody treatment), but data are conflicting, reflecting differences in datasets and methodologies and possibly tumor heterogeneity (32,43,49–54). Retrospective data from 2721 patients with colorectal cancer from the RASCAL (ie, the Kirsten ras in Colorectal Cancer Collaborative Group) study (43) indicated that KRAS mutations may be associated with increased risk of death (P = .002). However, in phase III monotherapy studies of cetuximab (55) or panitumumab (13,27), KRAS mutations did not appear to affect outcome among patients receiving only best supportive care. Furthermore, KRAS mutations do not appear to have a stage-specific prognostic value: No association between tumor KRAS mutations and relapse-free survival was observed among patients with stage II and stage III colorectal cancer in the Pan-European Trials in Adjuvant Colon Cancer (PETACC) 3 study (54).
KRAS Mutations.
A number of groups undertook retrospective testing of KRAS status of tumors from patients with metastatic colorectal cancer who were treated with cetuximab or panitumumab (with or without chemotherapy) (26,33,34). Lievre et al. (34) first reported the link between KRAS mutations and lack of response to EGFR-targeted monoclonal antibodies, a concept previously proposed by Moroni et al. (26), based on their cohort study (n = 30 patients). These findings were confirmed and extended to BRAF in a series of 48 patients by Benvenuti et al. (33), who also found that transfection of mutated KRAS (G12V) into wild-type DiFi colorectal cancer cells confers resistance to cetuximab. KRAS mutations have since emerged as a major predictor of resistance to panitumumab or cetuximab in the clinical setting. Studies (27,34,36,55–60) of patients receiving first and subsequent lines of treatment have found that those with tumors carrying KRAS mutations do not respond to EGFR-targeted monoclonal antibodies or experience any survival benefit from such treatment. Indeed, the progression-free interval in patients with tumors carrying mutant KRAS generally appears to be approximately half that of those patients whose tumors carry wild-type KRAS (Table 2).
Tumor KRAS mutations and outcome of panitumumab- or cetuximab-based treatment in patients with metastatic colorectal cancer*
| First author(reference) | Treatment [type of study; type of patients] | No. of patients with KRAS mutation/total No. of patients (%) | Outcome by KRAS status, No. of patients (%)† | Association of KRAS mutation with response and survival parameters | |||||
| Complete or partial response | Stable disease | Progressive disease | |||||||
| MT | WT | MT | WT | MT | WT | ||||
| Monotherapy | |||||||||
| Amado (27)‡* | Panitumumab, [phase III, chemotherapy refractory] | 84/208 (40) | 0/84 (0) | 21/124 (17) | 10 (12) | 42 (34) | 59 (70) | 45 (36) | KRAS mutation associated with shorter PFS vs wild type (7.4 vs 12.3 wk): no benefit of panitumumab vs BSC in this subgroup |
| Amado (27)§ | Panitumumab crossover [phase III extension, chemotherapy refractory] | 77/168 (46) | 0/77 (0) | 20/91 (22) | 20 (26) | 35 (38) | 37 (48) | 23 (25) | |
| Freeman (36) | Panitumumab [patient cohort, chemotherapy refractory] | 24/62 (39) | 0/24 (0) | 4/38 (11) | 5 (21) | 20 (53) | 19 (79) | 14 (37) | Median PFS = 7.4 wk for MT KRAS vs 16.2 wk for WT. Median OS = 22.2 wk for MT KRAS vs 42.9 wk for WT |
| Karapetis (55) | Cetuximab [phase III, chemotherapy refractory] | 81/198 (41) | 1/81 (1) | 15/117 (13) | NA | NA | NA | NA | KRAS mutation associated with shorter PFS and OS vs WT (P < .001 for both) |
| Khambata-Ford (59)* | Cetuximab [NA, chemotherapy refractory] | 30/80 (38) | 0/30 (0) | 5/50 (10) | 3 (10) | 19 (38) | 27 (90) | 26 (52) | KRAS mutations found in three (11%) DC vs 27 (51%) NR (P < .001) and associated with lower DC rate (10% vs 48%; P < .001) but similar PFS (59 vs 61 d) |
| Mainly combination therapy | |||||||||
| Benvenuti (33) | Cetuximab ± CT or panitumumab [patient cohort, chemotherapy naïve and refractory] | 16/48 (33) | 1/16 (6) | 10/32 (31) | 5 (31) | 8 (25) | 10 (63) | 14 (44) | KRAS/BRAF mutation negatively associated with PR (P < .01). KRAS mutation associated with shorter TTP (P = .04) |
| De Roock (57) | Cetuximab ± CT [patient cohort, chemotherapy refractory] | 42/108 (39) | 0/42 (0) | 27/66 (41) | 31 (74) | 28 (42) | 11 (26) | 11 (17) | KRAS mutation found in 0% of OR vs 52% of NR (P < .001) and associated with shorter OS (27.3 vs 43.0 wk (P = .02) |
| Di Fiore (56) | Cetuximab + CT [patient cohort, chemotherapy refractory] | 22/59 (37) | 0/22 (0) | 12/37 (32) | 5 (23) | 14 (38) | 17 (77) | 11 (30) | KRAS mutation was associated with PD (P < .001) and shorter TTP (3 vs 5.5 mo; P < .01) |
| Lievre (34) | Cetuximab ± CT [patient cohort, chemotherapy naïve and refractory] | 13/30 (43) | 0/13 (0) | 11/17 (65) | 4 (31) | 2 (12) | 9 (69) | 4 (24) | KRAS mutation associated with shorter OS (6.9 vs 16.3 mo; P = .02) |
| Lievre (60) | Cetuximab + CT [patient cohort, chemotherapy refractory] | 24/89 (27) | 0/24 (0) | 26/65 (40) | NA | NA | NA | NA | KRAS mutation associated with shorter PFS (10.1 vs 31.4 wk; P < .001) and OS (10.1 vs 14.3 mo; P = .03) |
| Combination with chemotherapy (first-line setting) | |||||||||
| Bokemeyer (28) | FOLFOX [phase II, chemotherapy naïve] | 47/233 (20) | 23/47 (49) | 27/73 (37) | 17/47 (36) | 30/73 (41) | 5/47 (11) | 12/73 (16) | Median PFS = 8.6 vs 7.2 mo in MT and WT patients, respectively |
| FOLFOX + cetuximab [phase II, chemotherapy naïve] | 52/233 (22) | 17/52 (33) | 37/61 (61) | 27/52 (52) | 19/61 (31) | 7/52 (13) | 3/61 (5) | No benefit of adding cetuximab to FOLFOX in KRAS MT patients, median PFS = 5.5 vs 7.7 mo in MT and WT patients, respectively | |
| Van Cutsem (29) | FOLFIRI [phase III, chemotherapy naïve] | 87/263 (33) | (40) | (43) | (46) | (44) | NA | NA | Median PFS = 8.1 vs 8.7 mo in MT and WT patients, respectively; median OS = 17.7 vs 21.0 mo in MT and WT patients, respectively |
| FOLFIRI + cetuximab [phase III, chemotherapy naïve] | 105/277 (38) | (36) | (59) | (47) | (31) | NA | NA | No benefit of adding cetuximab to FOLFIRI in KRAS MT patients, median PFS = 7.6 vs 9.9 mo in MT and WT patients, respectively; median OS = 17.5 vs 24.9 mo in MT and WT patients, respectively | |
Studies that prospectively evaluated biomarkers. BSC = best supportive care; CR = complete response; CT = chemotherapy; DC = disease control (PR or SD); FOLFIRI = folinic acid, fluorouracil, and irinotecan; FOLFOX = folinic acid, fluorouracil, and oxaliplatin; MT = mutant; NA = not available; NR = nonresponse or nonresponder; OR = objective response or responder; OS = overall survival; PD = progressive disease; PFS = progression-free interval; PR = partial response or responder; SD = stable disease; TTP = time to disease progression; WT = wild type.
Expressed as a percentage of patients within the MT and WT subgroup. (the denominator is also shown in the first two columns).
Phase III comparison of panitumumab vs BSC (data for panitumumab recipients only are shown).
Patients initially assigned to BSC who crossed over to panitumumab treatment after disease progression in the phase III study.
The pivotal randomized phase III study of panitumumab monotherapy in the relapsed or refractory setting (13) was the first large study (n = 463 patients) to confirm the negative predictive value of KRAS mutations (27). Biomarker analysis of primary tumor tissue was planned in the protocol and KRAS analysis was performed in a blinded manner at a central laboratory by use of a KRAS testing kit (DxS Ltd, Manchester, UK) (27). Among the 463 patients enrolled in this study, 427 (92%) were included in the KRAS analysis. Of these 427, 184 (43%) were found to have tumors harboring mutant KRAS: 84 (40%) of the 208 patients randomly assigned to panitumumab plus best supportive care and 100 (46%) of the 219 patients assigned to best supportive care alone. Among the 208 patients assigned to panitumumab, 21 (17%) of the 124 patients in the wild-type KRAS subgroup achieved objective response, whereas none of the 84 patients in the mutant KRAS subgroup responded to this treatment. Median progression-free interval among those treated with panitumumab was 12.3 weeks among those in the wild-type KRAS subgroup and 7.4 weeks among those in the mutant KRAS subgroup. The hazard ratio (HR) for disease progression or death (panitumumab vs control group) was 0.45 (95% confidence interval [CI] = 0.34 to 0.59) for panitumumab in the wild-type KRAS subgroup, but there was no benefit of panitumumab in the mutant KRAS subgroup (HR = 0.99, 95% CI = 0.73 to 1.36) (Figure 2). A sensitivity analysis that adjusted for potential bias from unscheduled assessment found similar results. A total of 168 (77%) of the 219 KRAS-evaluable patients initially assigned to the control group crossed over to receive panitumumab after disease progression, at a median time of 7.1 weeks; this crossover confounded analysis of overall survival. Among these 168 patients, 20 (22%) of the 91 in the wild-type KRAS subgroup, compared with none in the mutant KRAS subgroup, responded to panitumumab treatment; it is important to note that these results were based on local review, whereas tumor response in the main study was based on central review (27).
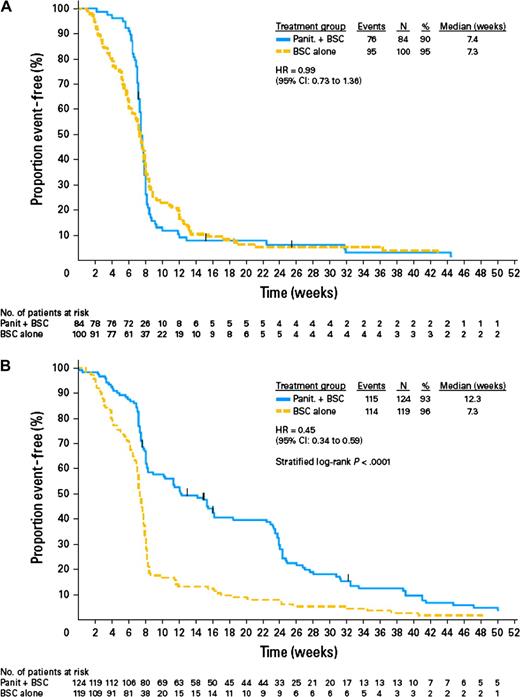
Progression-free interval and KRAS mutation status of tumor in patients with metastatic colorectal cancer who were randomly assigned to treatment with best supportive care (BSC) alone or panitumumab (Panit) plus BSC in a phase III study (27). A) Tumors with mutant KRAS status. B) Tumors with wild-type KRAS status (27) (with permission from the American Society of Clinical Oncology). CI = confidence interval; HR = hazard ratio.
KRAS data from three large randomized phase II–III cetuximab studies have recently been published, including the first-line OPUS (ie, Oxaliplatin and Cetuximab in First-Line Treatment of metastatic colorectal cancer) (28) and CRYSTAL (ie, Cetuximab Combined With Irinotecan in First-Line Therapy for Metastatic Colorectal Cancer) (29) studies and the NCIC-CTG (ie, National Cancer Institute of Canada-Clinical Trials Group) monotherapy study conducted in relapsed or refractory patients or those with contraindications to chemotherapy (55). Data from 394 (69%) of the 572 KRAS-evaluable patients participating in the phase III NCIC–CTG trial confirmed that patients with tumors carrying KRAS mutations do not benefit from cetuximab monotherapy. Both progression-free and overall survival were similar for the cetuximab and control groups in those patients with tumors carrying KRAS mutations (progression-free interval = 1.8 vs 1.8 months [HR = 0.99, 95% CI = 0.73 to 1.35, P = .96]; overall survival = 4.6 vs 4.5 months [HR = 0.98, 95% CI = 0.70 to 1.37, P = .89]). However, in the subgroup whose tumors carried wild-type KRAS, cetuximab treatment was associated with statistically significantly (P < .001) longer survival than control treatment (progression-free interval = 3.7 vs 1.9 months [HR = 0.40, 95% CI = 0.30 to 0.54]; overall survival = 9.5 vs 4.8 months [HR = 0.55, 95% CI = 0.41 to 0.74, P < .001]) (55). It should be noted that unlike the pivotal panitumumab phase III study (13), the design of this study did not allow patients from the control group who had disease progression to cross over to monoclonal antibody treatment. Final retrospective data from the OPUS and CRYSTAL studies indicate that the addition of cetuximab to first-line FOLFOX (folinic acid, fluorouracil, and oxaliplatin) (28) or FOLFIRI (folinic acid, fluorouracil, and irinotecan) (29) chemotherapy does not benefit patients with tumors carrying KRAS mutations, although those patients can benefit from chemotherapy alone (Table 2). Indeed, findings of the OPUS study indicate that addition of EGFR-targeted treatment to chemotherapy may even be detrimental in such patients (28) (Table 2).
In the PACCE (ie, Panitumumab Advanced Colorectal Cancer Evaluation) study (16), adding panitumumab to bevacizumab and chemotherapy was associated with shortening of the progression-free interval among patients with tumors carrying wild-type KRAS (11.5 months in the chemotherapy–bevacizumab arm vs 9.8 months in the panitumumab-chemotherapy–bevacizumab arm). In the CAIRO (ie, Capecitabine, Irinotecan, and Oxaliplatin trial)–2 study (17), addition of cetuximab to capecitabine, oxaliplatin, and bevacizumab as first-line treatment in patients with metastatic colorectal cancer had no effect on progression-free interval among those with tumors carrying wild-type KRAS (10.6 months in the chemotherapy–bevacizumab arm vs 10.5 months in the combined cetuximab arm). However, this combination had a marked detrimental effect among patients with tumors carrying mutated KRAS (12.5 vs 8.1 months) (17).
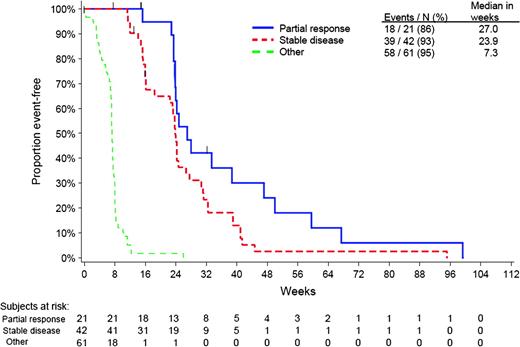
The proportion of patients bearing wild-type KRAS tumors who fail to achieve either objective response or disease stabilization with panitumumab or cetuximab varies considerably between studies (Table 2). Among a total of 124 patients with such tumors who were treated with panitumumab in the pivotal phase III study, 45 (36%) had a best response of progressive disease (61). These patients had a median progression-free interval of 7.3 weeks, as shown by a post hoc subanalysis (Figure 3). However, among patients with stable disease or a partial response, median progression-free interval was 23.9 and 27.0 weeks, respectively (61).
It is interesting to note that in other solid tumor settings, EGFR inhibitors (tyrosine kinase inhibitors or cetuximab) have shown minimal activity in patients with pancreatic cancer (62,63), which is associated with a very high prevalence of KRAS mutations (approximately 90%) (64), and in patients with lung cancer whose tumors carry KRAS mutations (65–67).
BRAF Mutations.
Recently published retrospective analysis (40) of 113 tumors from patients who received panitumumab or cetuximab in second or subsequent lines of treatment showed that those with tumors that carried BRAF V600E mutations (n = 11, 10%) did not respond to EGFR inhibition and had statistically significantly shorter progression-free interval (P = .001) and overall survival (P < .001) than patients whose tumors carried wild-type BRAF (n = 34). A similar pattern was observed in an analysis of 231 tumors from patients treated with first-line cetuximab plus capecitabine, oxalipatin, and bevacizumab in the CAIRO-2 study (41). The median progression-free interval and overall survival were 6.6 and 15.2 months for patients with tumors carrying mutant BRAF (n = 28), vs 10.4 (P = .01) and 21.5 (P = .001) months in those with tumors carrying wild-type BRAF (n = 231). However, the response rate did not differ between these two patient subgroups (39% vs 48%; P = .04).
Di Nicolantonio et al. (40) also demonstrated that introduction of the BRAF V600E allele could confer resistance to either cetuximab or panitumumab in wild-type BRAF colorectal cancer cells. Furthermore, they showed that the multikinase inhibitor sorafenib may restore sensitivity to EGFR inhibitors in BRAF-mutated colorectal cancer cell lines. Consequently, combined sorafenib and cetuximab therapy is undergoing clinical evaluation in metastatic colorectal cancer in a National Cancer Institute–sponsored trial (NCT00343772; http://clinicaltrials.gov/ct2/show/NCT00343772). Evaluation of EGFR-targeted antibodies in combination with other novel and more selective BRAF inhibitors, such as PLX-4032 and XL-281, is also warranted.
PTEN and PI3K.
Loss of expression of the tumor suppressor PTEN protein, which regulates the PI3K–Akt signaling pathway, has been reported to confer tumor resistance to EGFR tyrosine kinase inhibitors in vitro (68) and has been linked to erlotinib resistance in patients with glioblastoma (69) and to trastuzumab resistance in patients with breast cancer (70). In vitro studies in various colon cancer cell lines have found that activating PIK3CA mutations or loss of PTEN expression appeared to confer resistance to cetuximab. Cell lines that had mutations in PIK3CA, or were PTEN null, and also had mutations in RAS or BRAF exhibited the greatest resistance to cetuximab (71). Similarly, in the clinical setting, deregulation of either PIK3CA or PTEN gene (via mutation or loss of expression; P = .02) (38) or PTEN protein expression loss alone (P < .001) (58) statistically significantly impaired response to cetuximab-based treatment in colorectal cancer patients. Frattini et al. (58) reported that none of 11 patients with tumor PTEN loss responded to cetuximab-based treatment, whereas 10 (63%) of 16 patients with intact PTEN protein expression were partial responders. Perrone et al. (38) also noted that none of three patients with PTEN mutation responded to treatment with cetuximab and irinotecan. In a total of 92 patients with metastatic colorectal cancer who were included in three biomarker analyses (26,34,38), nine (10%) had tumors bearing PIK3CA mutations and only one responded to EGFR-targeted treatment. In a larger patient series (n = 110), Sartore-Bianchi et al. (72) found that PIK3CA mutations and PTEN loss in colorectal tumors were statistically significantly associated with lack of response to panitumumab (zero of 15 patients, P = .038) or cetuximab (one of 32 patients, P = .001) treatment. In the same study, PIK3CA mutations and/or loss of PTEN expression were negatively associated with progression-free interval, and loss of PTEN expression was also linked with poorer overall survival (P = .005). These investigators suggested that combining mutation analysis for KRAS and PIK3CA (loss of PTEN and/or PIK3CA mutation) could identify up to 70% of patients with metastatic colorectal cancer who are unlikely to respond to treatment with an EGFR-targeted monoclonal antibody (72). Contradictory evidence was recently reported by Prenen et al. (73) who found no strong rationale for using PIK3CA mutations as a single marker for sensitivity to cetuximab in chemotherapy-refractory metastatic colorectal cancer. Razis et al. (74) reported that normal PTEN protein expression was associated with a higher response rate and longer time to progression in patients treated with cetuximab-based therapy, despite a 50% response rate observed in patients who had lost PTEN protein expression (74). Because this study included patients treated with first-line cetuximab and chemotherapy, these findings are difficult to interpret. Further investigation and prospective data from large randomized clinical trials are required to confirm these findings before they can be integrated into clinical practice.
Because tumors with oncogenic PIK3CA mutations are likely to be driven by PI3K as the primary source of growth, proliferation, and survival signaling (Figure 1), the use of selective PI3K inhibitors is being tested in ongoing trials. Indeed, several PI3K inhibitors are progressing from preclinical development to phase I clinical studies. This family of compounds includes XL147, GDC-0941, BGT226, and the pan-PI3K–mammalian target of rapamycin (mTOR) inhibitors XL765 and NVP-BEZ235 (75). The combination of cetuximab and the mTOR inhibitor everolimus has been shown to be effective in restoring growth inhibition in cetuximab-resistant colorectal cancer cells (76). It remains to be evaluated in clinical trials whether concomitant inhibition of the EGFR and PIK3CA pathways (Figure 1) will convey clinical benefit.
In addition, in colorectal cancer, the incidence of PIK3CA and BRAF mutations (but not mutations of KRAS or TP53) displays a gender bias with a higher frequency occurring in women (32,77). Thus, it could be hypothesized that female patients with metastatic colorectal cancer might be less likely to benefit from treatment with EGFR-targeted monoclonal antibodies. However, available clinical data do not support this hypothesis (17,27,29).
EGFR as a Target
Many technical reasons have been advocated for the lack of association between EGFR detection by immunohistochemistry and response to EGFR-targeted treatment, as discussed by Shia et al. (78). These reasons include disparity between the form or epitope of EGFR detected by immunohistochemistry and that targeted by anti-EGFR monoclonal antibodies, as well as issues related to processing and handling of tumor tissue samples, such as prolonged storage. Immunohistochemistry is also a semiquantitative method that lacks a standardized scoring system and is subject to interobserver variation. Moreover, differences between primary colorectal tumors and their metastases with regard to EGFR expression have been reported (79), indicating that reliance on such biomarkers in the primary tumor to predict treatment response of metastatic growths may be inappropriate.
EGFR Affinity and Phosphorylation.
Using a specific ligand-binding assay, Francoual et al. (80) found that many tumors contain both low- and high-affinity EGFRs: 64 (78%) of 82 tumor specimens contained only high-affinity binding sites (median dissociation constant = 0.75 nM) and 18 (22%) had both low- and high-affinity sites. Because immunohistochemistry-based methods cannot distinguish between low- and high-affinity EGFR, these findings may provide further explanation for the lack of correlation between EGFR immunostaining and clinical response to EGFR-targeted treatment.
EGFR phosphorylation status may reflect the level of receptor utilization by the tumor. This parameter (as determined by immunohistochemistry) was associated with clinical response in patients treated with cetuximab-based therapy. Patients with an activated or phosphorylated EGFR score, as indicated by an immunohistochemistry-based visual score of 7 or greater, were almost twice as likely to have disease control (objective response or stable disease) than those with a score of less than 7 (100% vs 54%; P = .05) (81).
EGFR Gene Status.
Activating mutations, including in-frame deletions and amino acid substitutions in exons 18, 19, and 21 in the EGFR catalytic domain, play an important role in determining responsiveness to tyrosine kinase inhibitors in the lung cancer setting (82,83). Such mutations are rare (26,84) or absent (57,85) in colorectal cancer tumors. Moroni et al. (26) detected one mutation (3.2%) among 31 patients with metastatic colorectal cancer, occurring in a patient who achieved stable disease for 24 weeks with cetuximab and chemotherapy treatment. This missense heterozygous mutation in exon 21 (Gly857Arg) affected a residue located within the activation loop of the EGFR catalytic domain and was one amino acid away from the Leu858Arg-activating mutation that has been identified in patients with lung cancer who respond to gefitinib or erlotinib (86). At disease progression, the patient whose tumor had this mutation was treated with gefitinib; this molecular alteration in EGFR was not associated with clinical response because the disease progressed after 4 weeks of treatment. Notably, a specific polymorphism of EGFR affecting exon 13 at residue 521 Arg/Arg (previously identified as residue 497, rs11543848) has been linked with improved overall survival in women with metastatic colorectal cancer (vs Lys/Lys and/or Lys/Arg variants), although the reverse pattern was observed in men with this disease (87). This same polymorphism has been linked to cetuximab response in other studies (88–90). Conflicting evidence also exists for a polymorphism affecting the ligand of EGFR, EGF, at position 61 (rs4444903) (89,91,92).
A small proportion of colorectal tumors overexpress EGFR via amplification of the gene, which can be detected by fluorescence in situ hybridization (FISH) (93) or chromogenic in situ hybridization (78). Although the intensity of protein expression was associated with the likelihood of gene amplification, immunohistochemistry had a low specificity (17% in primary tumors and 23% in metastatic tumors) for predicting gene amplification (78).
When EGFR gene copy number was evaluated by polymerase chain reaction, no association was found between this parameter and clinical outcome of panitumumab- or cetuximab-based treatment (26,57,85), probably because of tumor DNA dilution by DNA from normal cells during DNA extraction. However, EGFR gene copy number as analyzed by FISH or chromogenic in situ hybridization appears to be a promising biomarker of response to such treatment (Table 3), and present technical limitations are being addressed in pathology studies (97). Methods of tissue processing and EGFR scoring systems differed between studies. Moreover, FISH pattern for EGFR expression is often nonhomogeneous in colorectal cancer tumors, with variable ratios of disomy vs polysomy or amplification being observed (93,94). Increased gene copy number was found in at least 30% of patients when a threshold value of approximately three EGFR copies per nucleus was used, as determined by FISH, compared with only 10% of patients when a threshold of six or more EGFR copies per nucleus was used, as determined by chromogenic in situ hybridization (Table 3). Statistically significant concordance between primary colorectal tumors and their metastases with regard to EGFR gene copy number has been found, as identified by FISH (95,96).
Tumor epidermal growth factor receptor gene copy number and outcome of panitumumab- or cetuximab-based treatment in patients with metastatic colorectal cancer*
| First author (reference) | Treatment [type of study; type of patients] | No of patients with increased GCN/total No. of patients (%) [cutoff†; methodology] | Outcome by GCN status, No. of patients (%)‡ | Association of increased EGFR GCN with response and survival parameters | |||||
| Complete or partial response | Stable disease | Progressive disease | |||||||
| Increased | Normal | Increased | Normal | Increased | Normal | ||||
| Monotherapy | |||||||||
| Sartore-Bianchi (94) | Panitumumab [patient cohort, chemotherapy refractory] | 20/58 (34) [≥2.47; FISH] | 6/20 (30) | 0/38 (0) | 5 (25) | 9 (24) | 9 (45) | 29 (76) | No OR if mean EGFR GCN of <2.47 copies per nucleus or <43% of tumor cells with chromosome 7 polysomy vs 6/20 (30%; P < .001) and 6/19 (32%; P < .001) among those with higher values. Mean EGFR GCN of <2.5 copies per nucleus or <40% of tumor cells with chromosome 7 polysomy associated with shorter PFS (P =.0153 and .0386, respectively) and OS (P = .0145 and .0290, respectively) |
| Other | |||||||||
| Cappuzzo (95) | Cetuximab ± CT [patient cohort, chemotherapy refractory] | 43/85 (51) [2.92; FISH] | 14/43 (33) | 1/42 (2) | NA | NA | NA | NA | Increased EGFR GCN associated with higher OR (P < .001) and longer TTP (6.6 vs 3.5 mo, P = .02) |
| Personeni (96) | Cetuximab ± CT [patient cohort, chemotherapy refractory] | [≥2.83; FISH] | NA | NA | NA | NA | NA | NA | Longer PFS (5.5 vs 4.0 mo, P = .25) and OS (10 vs 8.3 mo, P = .037) in patients with mean GCN ≥2.83 |
| Frattini (58) | Cetuximab ± CT [patient cohort, chemotherapy naïve and refractory] | 8/27(30) [≥3 EGFR/ CEP7; FISH] or 16/27 (59) [≥4.00 EGFR] | 6/8 (75) or 4/16 (25) | 0/3 (0) | 0/8 (0) or 2/16(12) | 1/3 (33) | 2/8 (25) or 10/16 (62) | 2/3 (67) | Two patients with increased EGFR GCN had PD, possibly due to concomitant KRAS mutations. All NR with EGFR gene amplification or increased GCN also showed concomitant KRAS mutations and/or absent PTEN expression |
| Lievre (34) | Cetuximab ± CT [patient cohort, chemotherapy naïve and refractory] | 3/30 (10)] [≥6; CISH]§ | 3/3 (100) | 8/27 (30) | 0 (0) | 6 (22) | 0 (0) | 13 (48) | Increased EGFR GCN in 27% of OR vs 0% of NR (P = .04) |
| Moroni (26) | Panitumumab or cetuximab ± CT [patient cohort, chemotherapy naïve and refractory] | 9/29 (31) [≥3; FISH] | 8/9‖ (89) | 1/20 (5) | 0 (0) | 5 (25) | 1(11) | 14 (70) | Increased EGFR GCN in 8/9 (89%) OR vs 1/20 (5%) NR (P < .001) |
CEP7 = chromosome 7 control; CISH = chromogenic in situ hybridization; CT = chemotherapy; EGFR = epidermal growth factor receptor; FISH = fluorescence in situ hybridization; GCN = gene copy number; NA = data not available; NR = nonresponders; OR = objective response or responder (ie, complete or partial response); OS = overall survival; PD = progressive disease; PFS = progression-free interval; PTEN = phosphatases and tensin homolog; TTP = time to disease progression.
Expressed as number per nucleus.
Expressed as a percentage of patients with increased or normal GCN (the denominator is also shown in the first two columns).
In more than 50% of cancer cells or presence of large gene copy cluster.
High overall response rate in this study was due to a clinical enrichment strategy.
Available data suggest that patients with less than three EGFR gene copies per nucleus have a relatively low likelihood of responding to EGFR-targeted monoclonal antibody treatment (34,56,94–96). In a retrospective analysis of a subgroup of patients participating in the pivotal phase III trial of panitumumab monotherapy (94), the mean EGFR gene copy number per nucleus and the percentage of tumor cells with chromosome 7 polysomy (three or more EGFR signals per nucleus) were analyzed by FISH and the association between these parameters and clinical outcome was assessed. None of the patients with a mean of <2.47 EGFR gene copies per nucleus or fewer than 43% of tumor cells with chromosome 7 polysomy, respectively, achieved objective response compared with six (30%) of the 20 patients (P = .001) and six (32%) of the 19 patients (P = .001) who had values above these thresholds. A mean EGFR gene copy number threshold of less than 2.5 copies per nucleus or fewer than 40% of tumor cells with chromosome 7 polysomy discriminated patients with shorter progression-free (P = .039 and P = .029, respectively) and overall survival (P = .015 and P = .014, respectively). EGFR gene copy number and chromosome 7 polysomy status did not draw a parallel with progression-free interval in patients receiving only supportive care in this study, suggesting that this parameter is not prognostic in metastatic colorectal cancer (94). These data contrast with earlier findings that were based on quantitative polymerase chain reaction analysis (85) showing that EGFR gene copy number, as assessed by this method, related to neither clinical response nor progression-free interval. Homogeneous (ie, 100%) chromosome 7 disomy was the most common pattern found in 58 colorectal tumors with nonincreased gene copy number (n = 26; 45%) (94). Chromosome 7 disomy is easier to detect than an increase in EGFR gene copy number and, therefore, might enable a more reproducible FISH assay. However, methods need to be further standardized for better reproducibility and optimum sensitivity (96,97).
In comparison with patients with normal EGFR gene copy number, patients with an increased EGFR gene copy number exhibit higher response rates to EGFR-targeted monoclonal antibodies, with a longer progression-free interval or time to progression (34,58,94–96) (Table 3). Two studies found that six (30%) of 20 patients and 14 (33%) of 43 patients with increased EGFR gene copy number had an objective response to panitumumab (94) or cetuximab with or without chemotherapy (95). Such response rates compare favorably with historical response rates reported for populations selected by EGFR immunostaining alone. Higher response rates were seen in other studies (Table 3). For instance, Moroni et al. (26) found an 89% response rate in a subgroup of nine patients with colorectal cancer whose tumors had an increased EGFR gene copy number, but these investigators included a relatively high proportion of responders (nine of 29 patients; 31%) in their analysis. In vitro studies by these investigators also showed that the proliferation of various colorectal cancer cell lines with amplified EGFR was completely inhibited by cetuximab at concentrations that did not affect proliferation of cells with unamplified EGFR (26). Logistic regression analysis indicated that the odds ratio for response to panitumumab was 5.62 (95% CI = 1.51 to 21.0) for increased vs normal mean EGFR gene copy number (94).
Overexpression of Other EGFR Ligands.
Elevated gene expression of alternative EGFR ligands, such as epiregulin and amphiregulin, may promote tumor growth and survival via an autocrine loop (59,98). Expression of high levels of mRNA for either epiregulin or amphiregulin has been associated with sensitivity to cetuximab monotherapy (59,98). Comparison of clinical outcomes for patients with high and low levels of these ligands showed a statistically significantly improved disease control rate (P < .001) and longer progression-free interval among patients with high expression of epiregulin (median = 103.5 vs 57 days, P < .001; HR = 0.47 [95% CI = 0.24 to 0.64]) or amphiregulin (median = 115.5 vs 57 days, P < .001; HR = 0.44 [95% CI = 0.21 to 0.57]) (59). The exclusive use of either KRAS status or amphiregulin or epiregulin gene expression profiles (59) does not result in the selection of identical patient populations who are likely to benefit from treatment with cetuximab: Among patients with wild-type KRAS, patients whose tumors expressed high levels of amphiregulin or epiregulin were likely to experience disease control, whereas patients whose tumors expressed low levels of these genes were not, thus providing important complementary information to KRAS status (99). Increased gene copy number of HER2 (the preferred heterodimer of EGFR) was linked to a statistically significantly shorter overall survival (P = .03), with a trend toward a shorter time to progression (P = .09), in 85 patients receiving cetuximab with or without chemotherapy (100).
Other Potential Biomarkers
Markers of angiogenesis and cell cycle regulation appear to be promising areas for further research. Angiogenesis is a prerequisite for growth and progression of tumors (101,102). Although driven by separate mechanisms, EGFR and the key angiogenic factor VEGF-1 share common downstream pathways (Figure 1). Findings of preclinical studies (conducted in human tumor cell lines xenografted into murine models that evaluated the combined pharmacological targeting of EGFR-dependent and VEGF-dependent pathways) indicate direct or indirect angiogenic effects of EGFR signaling (103–106). Furthermore, expression of VEGF-1 or its receptor has been linked to resistance to EGFR-targeted agents in various cancer cell lines (107) and in patients with metastatic colorectal cancer (108). Markers that have been positively linked to outcome in patients with metastatic colorectal cancer who were treated with EGFR-targeted monoclonal antibodies include expression or gene polymorphisms of cyclooxygenase-2 (108,109), interleukin-8 (108,109), and the cell cycle regulator cyclin D1 (93,108,109). For instance, Vallböhmer et al. (108) concluded that a combination of low gene expression levels of cyclooxygenase-2, EGFR, and interleukin-8 was statistically significantly related to the overall survival of patients who were treated with cetuximab monotherapy (13.5 vs 2.3 months in those with high gene expression levels of these three genes; P = .028). Feedback mechanisms and complex cellular circuits further link expression of VEGF, interleukin-8, and cyclooxygenase-2 to the oncogenic activation of KRAS and BRAF genes. For example, expression of cyclooxygenase-2, an upstream regulator of EGFR activity, is driven via the EGFR cascade (Figure 1), and in particular oncogenic KRAS has been shown to induce cyclooxygenase-2 expression (110,111). In addition, increased expression of cyclooxygenase-2 may result in increased production of prostaglandin E2, which in turn can transactivate EGFR (112). Expression of the transcription factor nuclear factor κB has also been linked with resistance to cetuximab (113).
Polymorphisms in fragment c gamma receptors, surface receptors for immunoglobulin G located on immune effector cells (such as natural killer lymphocytes and macrophages), are also of interest as potential markers of response to EGFR-targeted monoclonal antibodies, although data are conflicting at present (109,114–116). Fragment c gamma receptors are thought to play a role in antibody-dependent cell-mediated cytotoxicity, which has been postulated as an additional mechanism of action for the IgG1 type of monoclonal antibodies, such as cetuximab, rituximab, and trastuzumab (117). Although it was initially believed that panitumumab, as an IgG2 monoclonal antibody, would not elicit antibody-dependent cell-mediated cytotoxicity, this phenomenon has recently been demonstrated in squamous cell head and neck carcinomas in vitro at concentrations that are analogous to therapeutic doses (117).
Molecular brakes that protect against inappropriate oncogene activation (such as TP53) may also be candidate biomarkers of sensitivity to anti-EGFR therapy, given that their inactivation may be required for tumor progression. Indeed, Oden-Gangloff et al. (118) suggest that TP53 mutations may be predictive of increased likelihood of response to cetuximab treatment, particularly in patients with wild-type KRAS status (118).
Early Response Evaluation
The characteristic “acneiform” skin rash observed in most patients who are treated with EGFR inhibitors has been studied as a potential marker of efficacy. This adverse effect is usually apparent after approximately 1 week of treatment and reaches maximum severity after 2–3 weeks. As with the tyrosine kinase inhibitor erlotinib in patients with lung cancer (24,119), skin toxicity has been consistently linked with higher response rates and longer survival among patients with metastatic colorectal cancer who have been treated with panitumumab (13,120) or cetuximab (7,11,12), whereas patients without rash appear to have a poor outcome. Figure 4 illustrates the relationship between survival and worst grade of rash among patients treated with panitumumab (13) or cetuximab (12) monotherapy in two phase III studies. A landmark analysis (including only patients who were progression free for ≥28 days to allow time for onset) of progression-free interval data from the panitumumab study (n = 231) showed a statistically significant benefit for patients with grade 2–4 skin toxicity compared with those with grade 1 skin toxicity (HR = 0.62, 95% CI = 0.44 to 0.88) (13).
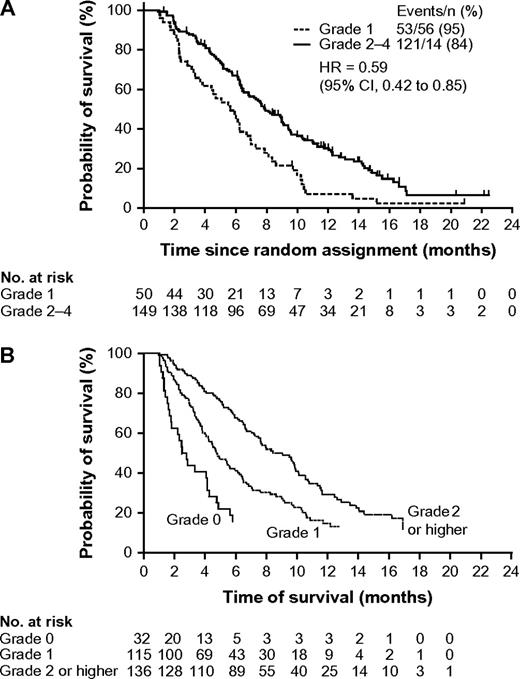
Probability of survival by worst grade of skin toxicity in patients with metastatic colorectal cancer who were treated with EGFR-targeted monoclonal antibodies in two randomized phase III studies. A) Patients treated with panitumumab. Data are from a landmark analysis that was limited to patients with progression-free interval of at least 28 days (13) (with permission from the American Society of Clinical Oncology. B) Patients treated with cetuximab (12). Reproduced with permission from the New England Journal of Medicine. Copyright 2007 Massachusetts Medical Society. All rights reserved. CI = confidence interval; HR = hazard ratio.
Rash might indicate receptor saturation, and “dose-to-rash” strategies are being studied with the aim of optimizing response to EGFR-targeted treatment. Preliminary data from the phase I–II Evaluation of Various Erbitux Regimens by means of Skin and Tumour biopsies (ie, EVEREST) study suggest that among patients receiving cetuximab-based treatment, cetuximab dose escalation to 500 mg/m2 per week may improve response rates in those with no or slight skin reactions (121), but the difference was not statistically significant and results require confirmation in a larger study. Subsequent analysis of results by KRAS status showed that cetuximab dose escalation did not increase response in patients with tumors carrying a mutant KRAS gene. However, among those with tumors carrying wild-type KRAS, this strategy improved the response rate from four (21%) of 19 patients to 13 (46%) of 28 patients (122). It is important to note that the panitumumab regimen of 6 mg/kg every 2 weeks, which is approved for treatment of metastatic colorectal cancer, achieves similar drug exposure to a regimen of 2.5 mg/kg per week, which was studied in early phase trials and was found to be associated with a 100% incidence of rash (123).
There are several limitations to the use of rash as an early physical marker of efficacy. As highlighted by De Roock et al. (57), there are no criteria for toxic effects involving skin that are specifically tailored to the activity of EGFR-targeted treatment. Rash often occurs in patients without apparent benefit from anti-EGFR treatment, and conversely, clinical benefit has also been seen in patients without rash (124). Because EGFR is expressed in the skin, skin rash may indicate local receptor saturation, but other factors, such as their immune status, might alter an individual’s susceptibility to rash. An association has been observed between tumor and normal tissue with regard to high-affinity EGFR. This finding might provide an explanation for the link observed between skin toxicity and clinical outcome of patients treated with EGFR-targeted treatment (81). Moreover, the relationship between rash and clinical benefit is inconsistent for the tyrosine kinase inhibitor gefitinib (124) and, intriguingly, rash is not observed in patients treated with the humanized anti-EGFR monoclonal antibody nimotuzumab (125,126), although it should be noted that efficacy data for this drug are currently limited.
Anti-EGFR monoclonal antibody treatment may compromise renal magnesium retention capacity, leading to hypomagnesemia in some patients with colorectal cancer (127). Vincenzi et al. (128) recently suggested that reduction in serum magnesium levels might potentially provide an early marker of efficacy of combined treatment with cetuximab and irinotecan. It has also been suggested that treatment with cetuximab may induce a sudden and lasting modulation of circulating VEGF levels (129), although the association between this finding and clinical efficacy was not reported.
Discussion and Future Perspectives
Although the link between clinical benefit and overexpression of the molecular target is clear for trastuzumab and imatinib and their respective targets (HER2 and the BCR-ABL tyrosine kinase), experience has shown that positive expression of EGFR as shown by immunostaining is not predictive of response to EGFR inhibitors. It is now clear that tumor growth can be driven by constitutive activation of signaling pathways downstream of the EGFR, such as the RAS–MAPK–PI3K pathway. Oncogenic activation of components in these pathways can bypass the EGFR-driven signaling cascade and impair the clinical efficacy of anti-EGFR monoclonal antibodies. Such activation can occur via mutations in oncogenes such as KRAS or BRAF on one side of the EGFR-mediated pathway or by PIK3CA mutation or loss of tumor suppressor genes such as PTEN on the opposite side of the cascade (72) (Figure 1). These findings may provide some explanation for the rather modest objective response rates that have been achieved with clinical trials of EGFR inhibitors to date, as well as the disparities observed between clinical and preclinical findings. It should also be noted that preclinical models are based on particular tumor subtypes that may not be representative of most tumors encountered in clinical practice.
Table 4 summarizes potential biomarkers that may be related to primary response to the anti-EGFR monoclonal antibodies, panitumumab and cetuximab. Overall, presently available data reviewed in this article provide convincing evidence that activating mutations of KRAS, which are present in a substantial proportion of patients with metastatic colorectal cancer, predict lack of response to anti-EGFR monoclonal antibody treatment (27–29, 33,34,55,60). This finding is consistent with observations from use of EGFR tyrosine kinase inhibitors in the treatment of non–small cell lung cancer, although KRAS mutations are less common in lung tumors (66,67).
Summary of potential predictive molecular biomarkers for response to the epidermal growth factor receptor (EGFR)–targeted monoclonal antibodies cetuximab and panitumumab in metastatic colorectal cancer*
| Relationship to response | Biomarker | First author (reference) |
| Predicts lack of response and now incorporated into clinical practice† | KRAS mutation | Amado (27); Bokemeyer (28); Van Cutsem (29); Table 2, this article; (20,130,131) |
| Very likely to predict lack of response | Mutation or lack of expression of PTEN; mutation of BRAF or PIK3CA | Frattini (58); Perrone (38); Benvenuti (33); Di Nicolantonio (40); Sartore-Bianchi (72); Di Nicolantonio (132) |
| May predict lack of response‡ | Increased HER2 gene copy number | Finocchiaro (100) |
| May predict increased likelihood of response | Increased EGFR gene copy number§ | Table 3, this article |
| Increased EGFR phosphorylation‡ | Personeni (81) | |
| Overexpression of alternative EGFR ligands (amphiregulin and/or epiregulin)‡ | Khambata-Ford (59) | |
| pAKt overexpression‡ | Razis (133) | |
| Other potential markers | Markers of angiogenesis and cell cycle regulation; transcription factors (VEGF, IL-8, COX-2, cyclin D, NFκB)‡ | Vallböhmer (108); Nagashima (109); Zhang (92) |
Data are based on analysis of tumor tissue from patients participating in clinical trials. COX-2 = cyclooxygenase-2; HER2 = human epidermal growth factor-2; IL-8 = interleukin-8; NFκB = Nuclear factor kappa B; pAkt = phosphorylated Akt; VEGF = vascular endothelial growth factor.
Based on data from a study that prospectively defined biomarker analysis and included a large number of patients (13).
Limited preliminary data.
Data need to be confirmed in large patient datasets, preferably with prospective study design.
KRAS testing is now being integrated into clinical practice. The European Medicines Agency's conditional approval of panitumumab monotherapy in the setting of chemorefractory metastatic colorectal cancer specified wild-type KRAS as a selection marker (134). Current data indicate that objective response rates of up to 22% can be expected in such patients (Table 2). It should be noted that clinical benefit is not confined to objective responders because delaying disease progression can improve clinical symptoms and the patient's quality of life (135). Wild-type KRAS was more recently identified as a selection marker for cetuximab monotherapy or combination therapy (136). The European Medicines Agency (20, 130), the US Food and Drug Administration (137), and the American Society of Oncology (131) now recommend determining tumor KRAS status before initiating treatment with an anti-EGFR monoclonal antibody and restricting such treatment to patients with tumors bearing wild-type KRAS.
Because of the complexity of the EGFR signaling system, it is likely that predictive algorithms will be developed for metastatic colorectal cancer that incorporate several molecular biomarkers. For instance, combining analysis of KRAS status with determination of BRAF and PIK3CA status and PTEN expression may identify additional patients with metastatic colorectal cancer who are unlikely to respond to treatment with an EGFR-targeted monoclonal antibody (133). However, these additional markers (Table 4) require further validation before they can be incorporated into clinical practice.
Tumors with an increased EGFR gene copy number as assessed by FISH or chromogenic in situ hybridization may be dependent on the EGFR pathway for their survival and growth. There is evidence that normal diploid EGFR gene copy number may predict tumor resistance to EGFR-targeted treatment (Table 3). Again, further research is required to validate this biomarker in larger patient series (97).
There are clearly a number of technical issues to be overcome, particularly standardization of analytical methods and scoring systems. Lack of standardization may well explain some of the discordant results that have been reported. Certainly, some biomarkers may not prove suitable for translation into clinical practice. However, DNA sequencing of formalin-fixed paraffin-embedded tumor samples is a relatively straightforward method for identifying KRAS mutations. Because KRAS mutation is an early event in colorectal cancer tumorigenesis (42,43), archived primary tumor tissue can be used to identify patients who are unlikely to respond to EGFR-targeted monoclonal antibodies, even after multiple lines of treatment. A KRAS testing kit from DxS Ltd can identify the following seven somatic mutations in KRAS codons 12 and 13: Gly12Ala, Gly12Arg, Gly12Asp, Gly12Ser, Gly12Cys, Gly12 Val, and Gly13Asp. The polymerase chain reaction–based technique used is highly sensitive but does not detect less frequent changes that can be detected with direct sequencing (eg, Gly13Val, Gly13Ala, and Gly13Cys). Although direct sequencing has the capability to detect all changes at the nucleotide level, it is less sensitive and may occasionally miss mutations, especially if the fraction of tumor vs normal cells is low (57). Testing will be facilitated by gene panel microarray technology and gene panels that incorporate KRAS testing are being evaluated (138).
Further work is also required to explore potential early markers of response (in patients already receiving EGFR-targeted treatment) that can be incorporated into the design of future prospective clinical trials and guide therapeutic decisions regarding continuation of treatment in individual patients. Skin toxicity develops at an early stage in treatment with EGFR inhibitors and has been studied extensively as a potential early marker of response, although further work is required.
Virtually all responding tumors eventually “escape” from EGFR-targeted treatment (ie, develop acquired resistance). In the lung cancer setting, acquired resistance to erlotinib or gefitinib has been attributed to development of a secondary mutation within the EGFR catalytic domain (139). Other potential escape mechanisms include activation of alternative signaling pathways contributing to proliferation and survival, such as those involving activation of HER2, HER3, mesenchymal–epithelial transition factor (C-MET), insulin-like growth factor-I receptor, MAPK, and Akt (140). Consequently, identification of the molecular basis of acquired resistance to anti-EGFR monoclonal antibodies in metastatic colorectal cancer should be a priority for future research.
In conclusion, the quest for predictive biomarkers of response to EGFR inhibitor therapy has resulted in a rapidly accumulating body of knowledge that has paved the way for more targeted use of these agents. More rational use of EGFR-targeted agents should provide benefits for patients and health-care providers alike by sparing patients unnecessary treatment and allowing better use of health-care resources. Prospective biomarker-driven studies are now under way, but in the meantime, the identification of wild-type KRAS as a selection biomarker for panitumumab or cetuximab therapy represents an important step toward fulfilling the promise of individualized treatment for metastatic colorectal cancer.
Funding
Funding for the writing of this manuscript was provided by Amgen (Europe) GmbH, Zug, Switzerland. This work was partly supported by grants from Oncologia Ca’ Granda Onlus Fondazione, Associazione Italiana Ricerca Cancro, Italian Ministry of Health, Regione Piemonte, EU FP6 MSCs contract 037297, EU FP7 Marie Curie, contract n 218071, CRT Progetto Alfieri. Amgen (Europe) GmbH had the opportunity to review the manuscript for accuracy.
References
J. Balfour was an employee of Amgen at the time that writing of this article commenced. She is currently a self-employed medical writer.
The authors had full responsibility for identification of articles, analysis and interpretation of the data, writing of the manuscript, and the decision to submit the manuscript for publication.
S. Siena, A. Sartore-Bianchi, A. Bardelli, and F. Di Nicolantonio have no financial interests, arrangements, or connections to declare.

