Article Text

Abstract
Objective Since December 2019, a newly identified coronavirus (severe acute respiratory syndrome coronavirus (SARS-CoV-2)) has caused outbreaks of pneumonia in Wuhan, China. SARS-CoV-2 enters host cells via cell receptor ACE II (ACE2) and the transmembrane serine protease 2 (TMPRSS2). In order to identify possible prime target cells of SARS-CoV-2 by comprehensive dissection of ACE2 and TMPRSS2 coexpression pattern in different cell types, five datasets with single-cell transcriptomes of lung, oesophagus, gastric mucosa, ileum and colon were analysed.
Design Five datasets were searched, separately integrated and analysed. Violin plot was used to show the distribution of differentially expressed genes for different clusters. The ACE2-expressing and TMPRRSS2-expressing cells were highlighted and dissected to characterise the composition and proportion.
Results Cell types in each dataset were identified by known markers. ACE2 and TMPRSS2 were not only coexpressed in lung AT2 cells and oesophageal upper epithelial and gland cells but also highly expressed in absorptive enterocytes from the ileum and colon. Additionally, among all the coexpressing cells in the normal digestive system and lung, the expression of ACE2 was relatively highly expressed in the ileum and colon.
Conclusion This study provides the evidence of the potential route of SARS-CoV-2 in the digestive system along with the respiratory tract based on single-cell transcriptomic analysis. This finding may have a significant impact on health policy setting regarding the prevention of SARS-CoV-2 infection. Our study also demonstrates a novel method to identify the prime cell types of a virus by the coexpression pattern analysis of single-cell sequencing data.
- infectious disease
- receptor binding
- medical decision analysis
This is an open access article distributed in accordance with the Creative Commons Attribution Non Commercial (CC BY-NC 4.0) license, which permits others to distribute, remix, adapt, build upon this work non-commercially, and license their derivative works on different terms, provided the original work is properly cited, appropriate credit is given, any changes made indicated, and the use is non-commercial. See: http://creativecommons.org/licenses/by-nc/4.0/.
Statistics from Altmetric.com
Significance of this study
What is already known on this subject?
Both of ACE2 and transmembrane serine protease 2 (TMPRSS2) are key proteins of severe acute respiratory syndrome coronavirus (SARS-CoV-2) cell entry process. Coexpression of these two proteins in the same cell is critical for viral entry.
Currently, the prime target cells of SARS-CoV-2 are unclear due to incomplete knowledge of the ACE2 and TMPRSS2 coexpression pattern in the cells of respiratory tract and digestive tract.
Though droplet transmission is considered as the main route of transmission, the other transmission routes remain unclear.
What are the new findings?
Alveolar type 2 cells are the main cell type coexpressing ACE2 and TMPRSS2 in lung tissue.
In addition, ACE2 and TMPRSS2 are also coexpressed in both upper epithelial and gland cells from oesophagus and absorptive enterocytes from ileum and colon.
How might it impact on clinical practice in the foreseeable future?
This study provides the evidence of a potential route of SARS-CoV-2 in the digestive system along with the respiratory tract based on single-cell transcriptomic analysis.
Faecal–oral transmission is a possible route of SARS-CoV-2 transmission. As such, these data may have significant impact for healthy policy setting regarding the prevention of SARS-CoV-2 infection.
Introduction
At the end of 2019, a rising number of patients with novel coronavirus pneumonia (coronavirus disease (COVID-19)) with unknown pathogenesis emerged in one of the largest cities of China, Wuhan, and quickly spread throughout the whole country.1 A novel coronavirus was then isolated from human airway epithelial cells and was named severe acute respiratory syndrome coronavirus (SARS-CoV-2).2 The complete genome sequences have revealed that SARS-CoV-2 shares 86.9% nucleotide sequence identity with a SARS-like coronavirus detected in bats (bat-SL-CoVZC45, MG772933.1). This study suggested that SARS-CoV-2 is a specie of SARS-related coronaviruses (SARSr-CoV) by pairwise protein sequence analysis.2 3
Regarding the clinical manifestations of SARS-CoV-2 infection, fever and cough are the most common symptoms at onset.3 4 In addition, 2%–10% of patients with COVID-19 had gastrointestinal symptoms such as vomiting, diarrhoea and abdominal pain.5 6 However, little is known about why and how SARS-CoV-2 induces enteric symptoms. In addition, it is currently unknown whether SARS-CoV-2 can be transmitted through the digestive tract in addition to through the respiratory tract.3
The prerequisite of coronavirus infection is its entrance into a host cell. During this process, the spike (S) glycoprotein recognises host cell receptors and induces the fusion of viral and cellular membranes.7 In SARS-CoV-2 infection, a metallopeptidase, ACE II (ACE2) has been proven to be the cell receptor, similar to SARS-CoV infection.8–11 Currently, evidence shows that SARS-CoV-2 requires ACE2 to enter the host cell.9 Beside, the transmembrane serine protease (TMPRSS2) is the main host cell protease which cleave the S protein of human coronaviruses on the cell membrane, allowing the virus to release fusion peptide for membrane fusion.12 13 Therefore, coexpression of ACE2 and TMPRSS2 is critical for the cell entry process of SARS-CoV-2.
To explore the susceptible cell types and potential infection routes of SARS-CoV-2, we analysed the coexpression pattern of ACE2 and TMPRSS2 in different cell types in both normal human lungs and the gastrointestinal system by single-cell transcriptomics based on public databases. A striking finding is that ACE2 and TMPRSS2 are coexpressed not only in lung alveolar type 2 (AT2) cells, but also in oesophagus upper cells upper epithelial and gland cells and absorptive enterocytes from the ileum and colon. These findings suggest that the enteric symptoms of COVID-19 may be associated with the invasion of SARS-CoV-2 into the ACE2 and TMPRSS2 coexpressing enterocytes. Our single-cell transcriptomic study for the first time provides the evidence which indicates that the digestive system along with the respiratory tract is a potential route of COVID-19 and may have a significant impact on health policy setting regarding the prevention of COVID-19.
Materials and methods
Data sources
Single-cell expression matrices for the lung, oesophagus, stomach, ileum and colon were obtained from the Gene Expression Omnibus (https://www.ncbi.nlm.nih.gov/),14 Single Cell Portal (https://singlecell.broadinstitute.org/single_cell) and Human Cell Atlas Data Portal. (https://data.humancellatlas.org). Single-cell data for the oesophagus and lung were obtained from the research published by Madissoon et al which contained six oesophageal and five lung tissue samples.15 The data of gastric mucosal samples from three non-atrophic gastritis and three chronic atrophic gastritis patients were obtained from GSE134520.16 GSE13480917 comprises 22 ileal specimens from 11 patients with ileal Crohn’s disease and only non-inflammatory samples were selected for analysis. The data from Smillie et al 18 included 12 normal colon samples.
Quality control
Low-quality cells with fewer than 200 or greater than 5000 expressed genes were removed. We further required the percentage of unique molecular identifiers (UMIs) mapped to mitochondrial to be less than 20%.
Data integration, dimension reduction and cell clustering
Different data processing methods were performed for different single-cell projects according to the downloaded data.
Oesophagus and lung datasets
Seurat19 rds data were directly downloaded from the supplementary material in Madissoon et al.15 Uniform manifold approximation and projection (UMAP) visualisation was performed to obtain clusters of cells.
Stomach and ileum datasets
a single-cell data expression matrix was processed with the R package Seurat (V.3.1.4).19 We first used ‘NormalizeData’ to normalise the single-cell gene expression data. UMI counts were normalised by the total number of UMIs per cell, multiplied by 10 000 for normalisation and log-transformed. The highly variable genes (HVGs) were identified using the function ‘FindVariableGenes’. We then used the ‘FindIntegrationAnchors’ and ‘Integratedata’ functions to merge multiple sample data within each dataset. After removing unwanted sources of variation, such as cell cycle stage and mitochondrial contamination, from a single-cell dataset, we used the ‘RunPCA’ function to perform a principal component analysis (PCA) on the single-cell expression matrix with significant HVGs. Then, we constructed a K-nearest-neighbour graph based on the Euclidean distance in PCA space using the ‘FindNeighbors’ function and applied the Louvain algorithm to iteratively group cells together with the ‘FindClusters’ function with optimal resolution. UMAP was used for visualisation purposes.
Colon dataset
the single-cell data expression matrix was processed with the R packages LIGER20 and Seurat.19 We first normalised the data to account for differences in sequencing depth and capture efficiency among cells. Then, we used the ‘selectGenes’ function to identify variable genes in each dataset separately and took the union of the result. Next, integrative non-negative matrix factorisation was performed to identify shared and distinct metagenes across the datasets and the corresponding factor loading for each cell using the ‘optimizeALS’ function in LIGER. We selected a k of 15 and lambda of 5.0 to obtain a plot of expected alignment. We then identified clusters shared across datasets and aligned quantiles within each cluster and factor using the ‘quantileAlignSNF’ function. Next, nonlinear dimensionality reduction was performed using the ‘RunUMAP’ function in Seurat and the results were visualised with UMAP plots.
Identification of cell types and gene expression analysis
We annotated cell clusters based on the expression of known cell markers and the clustering information provided in the articles. Then, we used the ‘RunALRA’ function in Seurat to impute lost values in the scRNA-seq data. Feature plots and violin plots were generated using Seurat to show the imputed gene expression. To compare gene expression in different datasets, we used ‘Quantile normalisation’ in the R package preprocessCore (R package V.1.46.0. https://github.com/bmbolstad/preprocessCore) to preprocess the data. Then, gene expression data were further denoised by adding random generation for the normal distribution with mean equal to mean and SD equal to SD
External validation
To minimise bias, external databases of Genotype-Tissue Expression (GTEx),21 and The Human Protein Atlas22 were used to detect gene and protein expression of ACE2 at the tissue level including normal lung and digestive system, such as oesophagus, stomach, small intestine and colon.
Results
Annotation of cell types
The gastrointestinal system is composed of the oesophagus, stomach, ileum, colon and cecum (figure 1A–E). In this study, five datasets with single-cell transcriptomes of the oesophagus, gastric mucosa, ileum and colon along with lung were analysed (online supplementary file 1).
Supplemental material
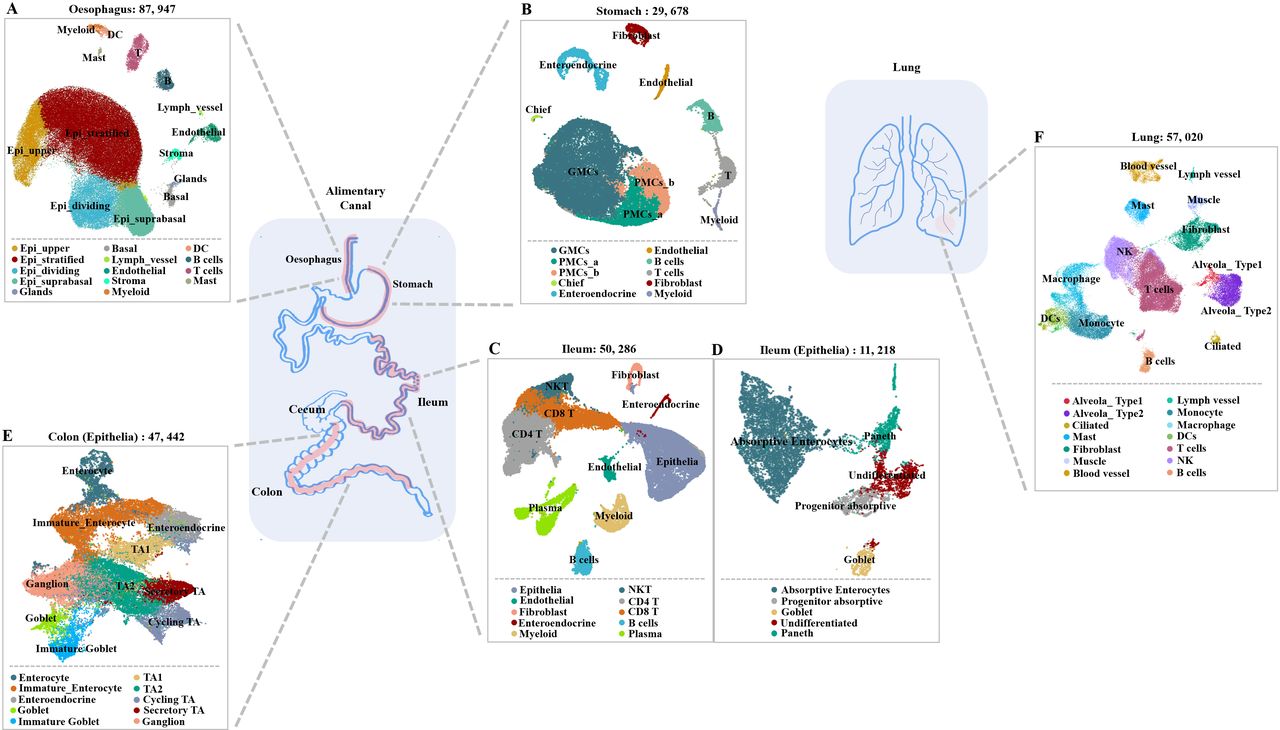
Single-cell atlas of digestive tract and lung tissues. (A–F) Uniform manifold approximation and projection (UMAP) plots showing the landscape of (A) oesophageal cells, (B) gastric mucosa cells, (C) ileal cells, (E) colon cells and (F) lung cells. (D) The ileal epithelial cells were further divided into finer cell subsets due to the heterogeneity within the cell population. DCs, dendritic cells; GMC, gland mucous cell; NKT, natural killer T; PMC, pit mucous cell; TA, transit amplifying.
In the oesophagus, 14 cell types were identified among 87 947 cells. Over 90% of the cells fell into four major epithelial cell types: upper, stratified, suprabasal and dividing cells of the suprabasal layer (figure 2A). The additional cells from the basal layer of the epithelium clustered most closely with the gland duct and mucous secreting cells. Lymph vessels and endothelial cells are associated with vessel tissues. Immune cells in the oesophagus include T cells, B cells, monocytes, macrophages, dendritic cells (DCs) and mast cells. The cell type identified in oesophagus cluster was annotated by the expression of known cell-type markers (figure 2B).

Single-cell analysis of oesophageal cells. (A) Uniform manifold approximation and projection (UMAP) plots showing the landscape of oesophageal cells. (B) Dot plot showing the marker genes for oesophageal cells. (C) UMAP plots showing the expression of ACE2 (blue) and transmembrane serine protease (TMPRSS2; red). The plots were merged to show the coexpression of these genes. (D) Violin plots for expression levels of ACE2 and TMPRSS2 across clusters. The expression is measured as the log2 (TP10K+1) value. DCs, dendritic cells.
A total of 29 678 cells and 10 cell types were identified in the stomach after quality control with a high proportion of gastric epithelial cells, including antral basal gland mucous cells (GMCs), pit mucous cells (PMCs), chief cells and enteroendocrine cells (figure 3A). The non-epithelial cell lineages were composed of T cells, B cells, myeloid cells, fibroblasts and endothelial cells. The cell type identified in stomach cluster was annotated by known cell-type markers (figure 3B).
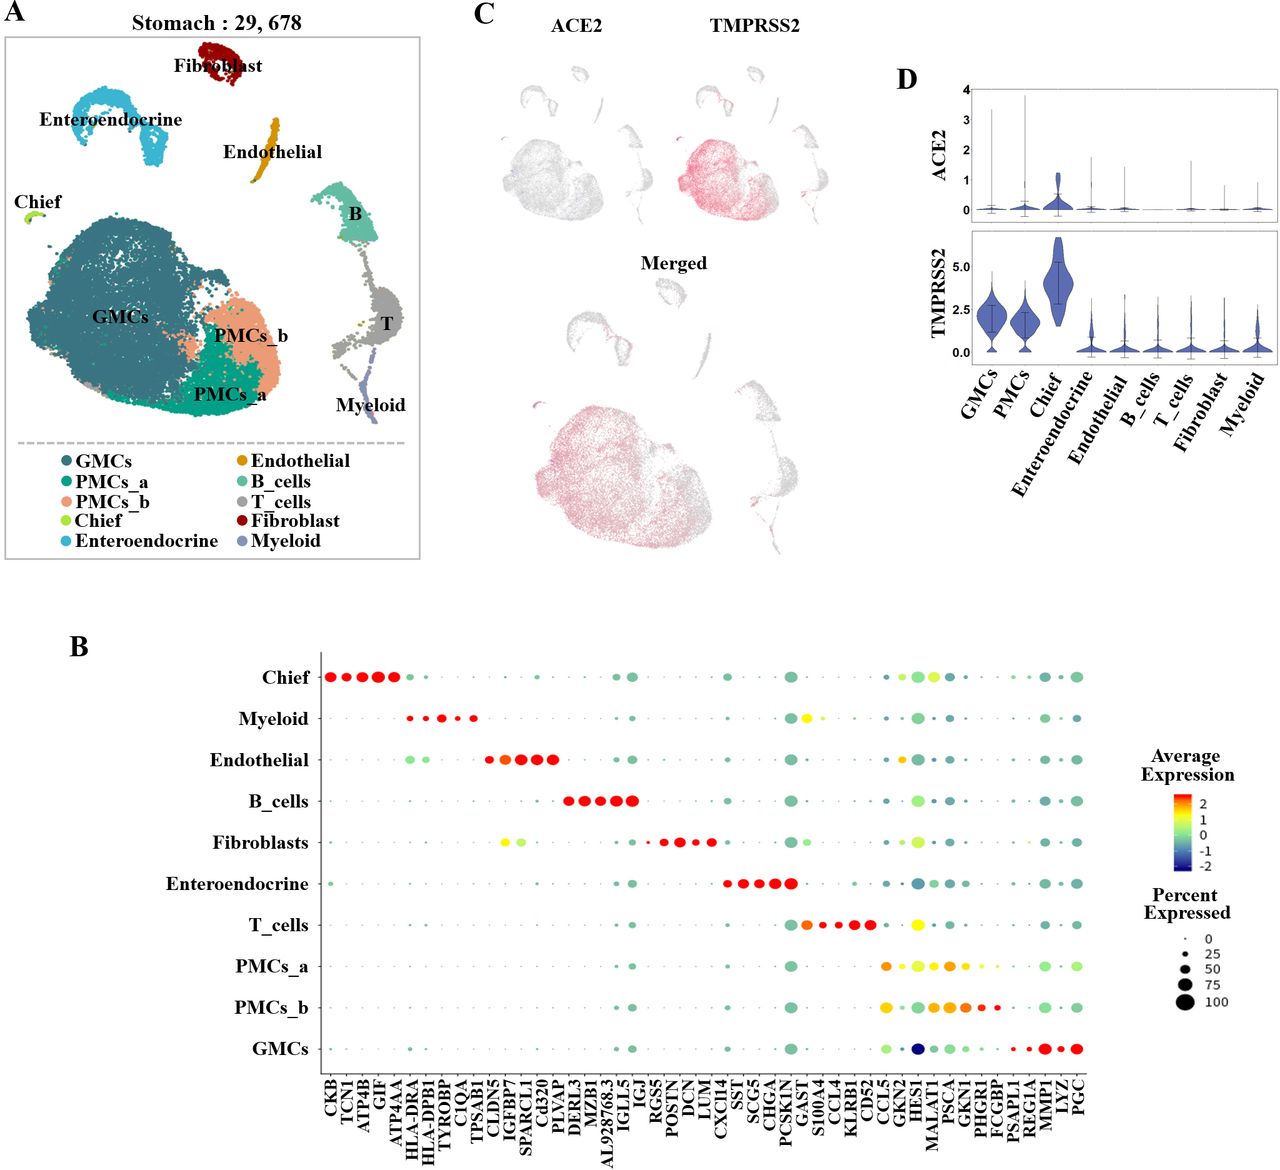
Single-cell analysis of gastric mucosal cells. (A) Uniform manifold approximation and projection (UMAP) plots showing the landscape of gastric mucosal cells. (B) Dot plot showing the marker genes for gastric mucosal cells. (C) UMAP plots showing the expression of ACE2 (blue) and transmembrane serine protease (TMPRSS2; red). The plots were merged to show the coexpression of these genes. (D) Violin plots for expression levels of ACE2 and TMPRSS2 across clusters. The expression is measured as the log2 (TP10K+1) value. DCs, dendritic cells; GMCs, gland mucous cells; PMCs, pit mucous cells.
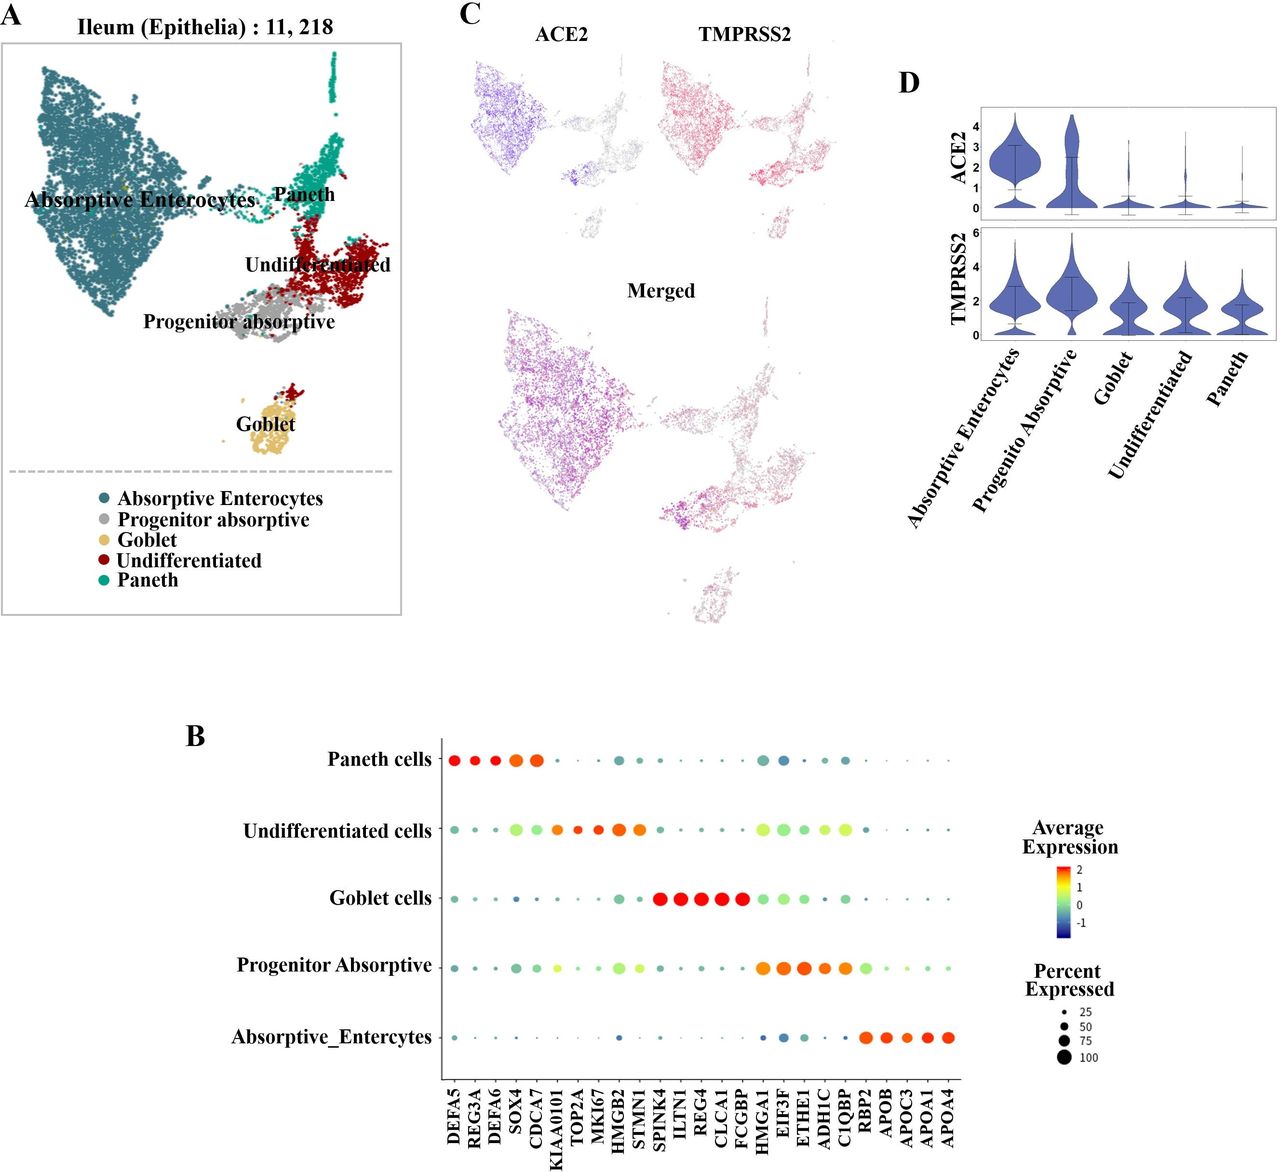
After quality controls, 50 286 cells and 10 cell types were identified in the ileum. The detected cell types included epithelial, endothelial, fibroblast and enteroendocrine cells. The identified immune cell types were myeloid, CD4+ T, CD8+ T and natural killer T cells, along with plasma and B cells. Among the 11 218 epithelial cells (figure 4A), 5 cell types were identified, namely, absorptive enterocytes, progenitor absorptive, goblet, Paneth and undifferentiated cells by known markers (figure 4B).

(Single-cell analysis of ileal epithelial cells. (A) Uniform manifold approximation and projection (UMAP) plots showing the landscape of ileal epithelial cells. (B) Dot plot showing the marker genes for ileal epithelial cells. (C) UMAP plots showing the expression of ACE2 (blue) and transmembrane serine protease (TMPRSS2; red). The plots were merged to show the coexpression of these genes. (D) Violin plots for expression levels of ACE2 and TMPRSS2 across clusters. The expression is measured as the log2 (TP10K+1) value.
All 47 442 epithelial cells from the colon, including absorptive and secretory clusters, were annotated after quality controls (figure 5A). The absorptive clusters included further subclusters for transit-amplifying (TA) cells (TA 1, TA 2), immature enterocytes and enterocytes. The secretory clusters included subclusters of progenitor cells (secretory TA and immature goblet cells) and of mature cells (goblet, and enteroendocrine cells). Ganglion cells and cycling TA cells were also identified in the final UMAP. The cell types were identified by known markers (figure 5B).

Single-cell analysis of colonic epithelial cells. (A) Uniform manifold approximation and projection (UMAP) plots showing the landscape of colonic epithelial cells. (B) Dot plot showing the marker genes for colonic epithelial cells. (C) UMAP plots showing the expression of ACE2 (blue) and transmembrane serine protease (TMPRSS2; red). The plots were merged to show the coexpression of these genes. (D) Violin plots for expression levels of ACE2 and TMPRSS2 across clusters. The expression is measured as the log2 (TP10K+1) value. TA, transit amplifying.
After initial quality controls were performed, 57 020 cells and 25 cell types were identified in the lung (figure 6A). The detected cell types included ciliated, alveolar type 1 (AT1) and -AT2 cells, along with fibroblast, muscle and endothelial cells. The identified immune cell types were T, B and NK cells, along with macrophages, monocytes and DCs. The cell types were identifiedby known markers (figure 6B).

Single-cell analysis of lung cells. (A) Uniform manifold approximation and projection (UMAP) plots showing the landscape of lung cells. (B) Dot plot showing the marker genes for lung cells. (C) UMAP plots showing the expression of ACE2 and transmembrane serine protease (TMPRSS2). The plots were merged to show the coexpression of these genes. (D) Violin plots for expression levels of ACE2 and TMPRSS2 across clusters. The expression is measured as the log2 (TP10K+1) value. DC, dendritic cell; NK, natural killer.
Cell type-specific ACE2 and TMPRSS2 expression
To determine which cell type was the potential target cell for SARS-CoV-2 in the lung and digestive system, we explored the expression levels of ACE2 and TMPRSS2 in all cell populations. In the oesophagus, ACE2 was highly expressed in upper and stratified epithelial cells. The glands also had low ACE2 expression levels. TMPRSS2 was expressed mainly in oesophagus upper epithelial and gland cells (figure 2C). However, the stratified epithelial cells expressed TMPRSS2 at very low levels (figure 2D). With regard to the stomach, the expression of ACE2 was relatively low in all clusters (figure 3C). However, TMPRSS2 was highly expressed in GMCs, PMCs and cheif cells (figure 3C,D). In the epithelial cells of the ileum, ACE2 was highly expressed in absorptive enterocytes and expressed at lower levels in progenitor absorptive cells. TMPRSS2-expressing cells were widely distributed in all epithelial cell subclusters (figure 4C,D). As for the colon, ACE2 was mainly found in enterocytes and was expressed at lower levels in immature enterocytes. (figure 5C). TMPRSS2 also showed high expression in enterocytes and immature enterocytes, which was similar to ACE2 . Relative low expression of TMPRSS2 was also found in Goblet, Ganglion and TA cells (figure 5C,D). In the lung, we found that ACE2 was mainly expressed in AT2 cells and was also found in AT1 and fibroblast cells. TMPRSS2 was also highly expressed in AT1 and AT2 cells (figure 6C,D). Therefore, AT2 cells, which have relatively high coexpression of ACE2 and TMPRSS2, may be the main host cells for SARS-CoV-2 (figure 6C,D).
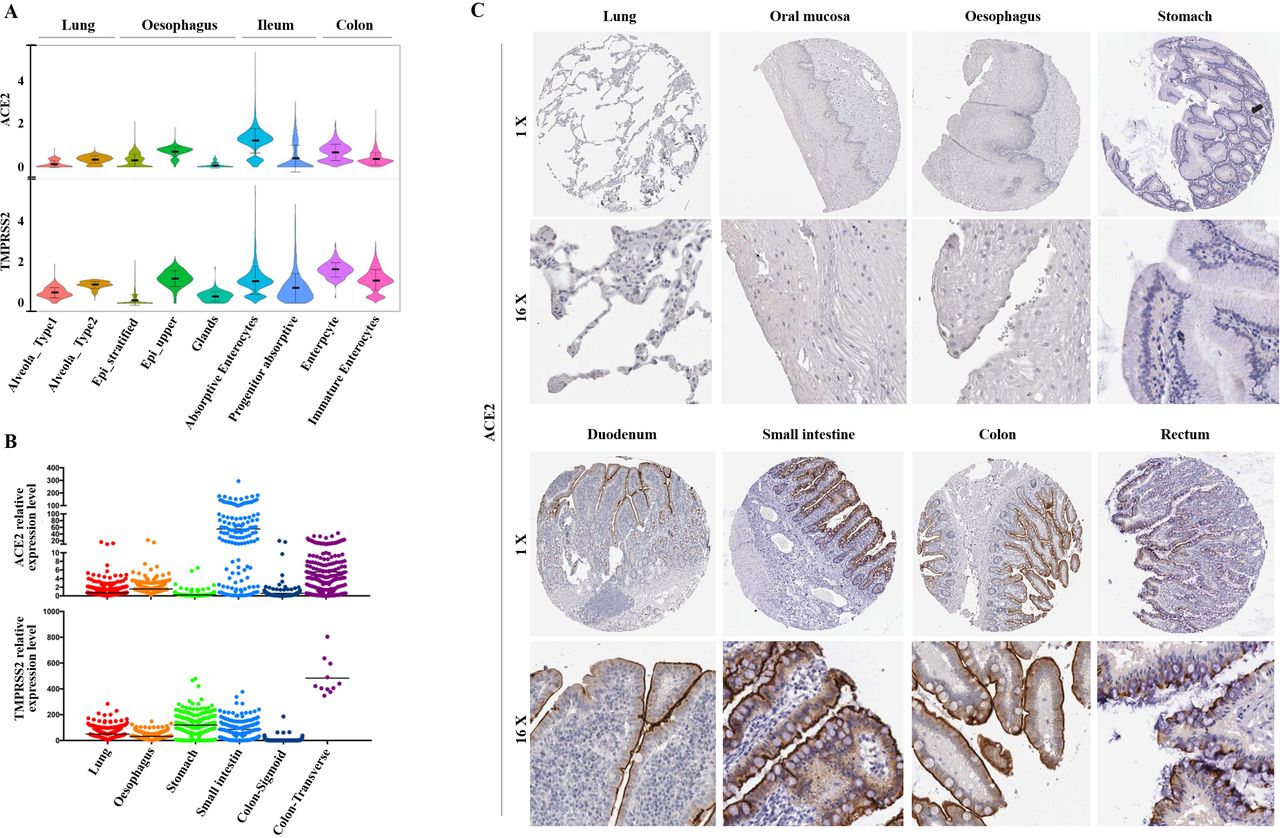
Among all the ACE2-expressing cells in the normal digestive system and lung, ACE2 was also relatively highly expressed in the ileum and colon (figure 7A). TMPRSS2 was further compared in these cells and they also showed relatively high expression in AT2, oesophagus upper and enterocytes from ileum and colon with relatively low expression in stratified epithelial cells from oesophagus (figure 7A). The RNA-seq data of the lung, oesophagus, stomach, small intestine, colon transverse and colon sigmoid were obtained from GTEx database (online supplementary file 2). ACE2 was highly expressed in small intestine and colon, with a relative low expression in lung and oesophagus (figure 7B). TMPRSS2 was highly expressed in lung, stomach, small intestine and transverse colon. However, relative low expression of TMPRSS2 was found in Sigmoid colon (figure 7B). In addition, we also collected immunohistochemical images to show the expression of ACE2 at the protein level (figure 7C). The representative pictures were derived from the lung (T-28000, patient 218), oral mucosa (T-51000, patient 48), oesophagus (T-62000, patient 3399), small intestine (T-65000, patient 493), stomach (T-63700, patient 148), duodenum (T-59000, patient 1904), colon (T-1×300, patient 3266) and rectum (T-68000, patient 1087). The results revealed that ACE2 was mainly expressed in duodenum, small intestine, colon and rectum, which was consistent with the RNA expression level (figure 7C).
Supplemental material

Expression of ACE2 and transmembrane serine protease (TMPRSS2) at RNA and protein levels in different tissues.(A) Violin plots for ACE2 and TMPRSS2 expression across two lung clusters and seven digestive tract clusters. The gene expression matrix was normalised and denoised to remove unwanted technical variability across the four datasets. (B) External validation of ACE2 and TMPRSS2 at RNA level in different tissues. The expression is measured as the pTPM value in the RNA-seq data from the Genotype-Tissue Expression database. (C) Representative immunohistochemical images of ACE2 in different tissues from the HumanProtein Atlas database.
Discussion
Coronaviruses are a common infection source in the upper respiratory, gastrointestinal tracts and central nervous system in humans and other mammals.23 To date, the infection routes of SARS-CoV-2 and its ability to infect the digestive system remain unclear. The virus entry process depends on the SARS-CoV receptor ACE2 and cellular serine protease TMPRSS2. It suggests that cells coexpressing ACE2 and TMPRSS2 are the most susceptible cells for infection while the cells expressing one of them remain safe. Thus far, most of the studies, expecially the single cell RNA-seq studies only focus on ACE2.24 25 Our study is the first study overlooked both of the key proteins in the virus entry process and it may provide a more comprehensive information of the potential target cell types. In addition, our study shows a novel method to identify the prime cell types of a virus by the coexpression pattern analysis of single-cell sequencing data.
In this study, we found coexpression of ACE2 and TMPRSS2 in lung AT1, AT2 cells, oesophageal upper epithelial and gland cells, and absorptive enterocytes from the ileum and colon. These findings directly show that, for the first time, ACE2 and TMPRSS2 expression is not limited to the lung and suggest that the extrapulmonary spread of SARS-CoV-2 may exist. In addition, these findings suggest that the enteric symptoms of COVID-19 may be associated with the invasion of SARS-CoC-2 into the ACE2 and TMPRSS2 coexpressing enterocytes.
Generally, many respiratory pathogens, such as influenza, SARS-CoV and SARSr-CoV, cause enteric symptoms, as is the case for SARS-CoV-2.3 4 As a classic respiratory coronavirus, SARS often causes enteric symptoms along with respiratory symptoms. Moreover, transmission via stool is also a neglected risk for SARS.26 The enteric symptoms of SARS and highly pathogenic strains of influenza are associated with increased permeability to intestinal lipopolysaccharide and bacterial transmigration through the gastrointestinal wall.27 28 However, the mechanism of SARS-CoV-2-induced enteric symptoms is still unknown.
ACE2 was found to interact with a defined receptor-binding domain of CTD1 in SARS-CoV and facilitate efficient cross-species infection and person-to-person transmission.8 29 The ‘up’ and ‘down’ transition of CTD1 allows ACE2 binding by regulating the relationship among CTD1, CTD2, the S1-ACE2 complex and the S2 subunit.30 In human HeLa cells, expressing ACE2 from human, civet and Chinese horseshoe bats can help many kinds of SARSr-CoV, including SARS-CoV-2, enter cells, indicating the important role that ACE2 plays in cellular entry.9 31–33 Structural analysis of the SARS-CoV-2 S protein that it binds ACE2 with higher affinity than does SARS CoV S protein.34
The TMPRSS2 can cleave SARS-S protein and render host cell entry independent of the endosomal pathway using cathepsin B/L.35 Different from cathepsin B/L, they can also promote viral spread in the host and cleave ACE2 to augment about 30-fold viral infectivity.36 37 In addition, the key sequence of SARS-CoV-2 spike protein cleavage has higher furin score (0.688) than thecorresponding sequence in SARS-CoV (0.139), which increases its infectivity.38 Serine protease inhibitor could also block SARS-CoV-2 infection of lung cells.13
By analysing the coexpression of ACE2 of TMPRSS2 in the normal human gastrointestinal system and lung, we identified AT2 cells the most susceptible cells in the lung due to its high expression of ACE2 and TMPRRS2. AT1cells could also be the host cells of infection, which have relatively lower expression than AT2 cells. These results were consistent with the findings of a previous study.39 In lung alveoli, AT1 epithelial cells are responsible for gas exchange and AT2 cells are in charge of surfactant biosynthesis and self-renewal.40 In SARS-CoV infection, AT2 is the major infected cell type, as assessed by viral antigen and secretory vesicle detection. Its expression in AT2 cells is variable in different donors, which may be associated with susceptibility and seriousness differences.39 Thus, we hypothesise that AT2 cells might be the key SARS-CoV-2-invaded cells in the lung and the number of AT2 cells might be associated with the severity of respiratory symptoms.
Besides the lung, coexpression of ACE2 and TMPRSS2 was found in oesophageal upper and gland cells and absorptive enterocytes from the ileum and colon. Histologically, both oesophageal and respiratory system organs, such as the trachea and lung, originate from the anterior portion of the intermediate foregut.41 After separating from the neighbouring respiratory system, the oesophagus undergoes subsequent morphogenesis from a simple columnar-to-stratified squamous epithelium.42 The upper epithelium can be nourished by submucosal glands and sustain the passage of abrasive raw food. In Barrett’s oesophagus, acid reflux-induced oesophagitis and the multilayered epithelium are associated with upper epithelial cells.43 In the digestive system, in addition to being expressed in oesophageal upper epithelial and gland cells, coexpression of ACE2 and TMPRSS2 was also found in the absorptive enterocytes from the ileum and colon, the most vulnerable intestinal epithelial cells. During microbial infections, intestinal epithelial cells function as a barrier and help coordinate immune responses.44 The absorptive enterocytes can be infected by coronavirus, rotavirus and noroviruses, resulting in diarrhoea by absorptive enterocytes destruction, malabsorption, unbalanced intestinal secretion and enteric nervous system activation.45–47 Although most virus would be dead in the strong acid environment in the stomach, there is still a possibility that the saliva and secretions could carry the virus into the digestive tract where viral replication may be sustained in these susceptible cells. Thus, the enteric symptom of diarrhoea might be associated with the infected ACE2-expressing and TMPRSS2-expressing enterocytes. This could also help explain the fact that 10% of patients presented with diarrhoea and nausea 1 or 2 days before the development of fever and respiratory symptoms.6
Moreover, due to the high expression of ACE2 and TMPRSS2 in oesophageal upper cells and absorptive enterocytes from the ileum and colon, we propose that the digestive system could be invaded by SARS-CoV-2 and might serve as a route of infection. This supposition was supported by the first case of SARS-CoV-2 in the USA, whose stool specimen obtained on illness day 7 was detected SARS-CoV-2 RNA.48 SARS-CoV-2 was also isolated from a stool specimen of a confirmed case in China.49 additionallyThe evidence that live virus in stool specimens further supports our hypothesis.
Conclusion
This single-cell transcriptomic study provides the evidence of the potential route of SARS-CoV-2 in the digestive system along with the respiratory tract. It may have a significant impact to health policy setting regarding the prevention of SARS-CoV-2 infection. In addition, our study provides a novel method to guide identification of prime cell types of a virus by thecoexpression pattern analysis of single-cell sequencing data.
References
Footnotes
HZ, ZK, HG and DX are joint first authors.
JZ, TM, WZ, JL and HX are joint senior authors.
HZ, ZK, HG and DX contributed equally.
JZ, TM, WZ, JL and HX contributed equally.
Contributors WZ and HZ: study design. HZ, WZ, HG and DX: data analysis. ZL, ZK, HG and DX: data collection and generation. JZ, JW, ZL, XC and JX: data interpretation. TM, ZK and HX: manuscript drafting. JZ, TM, WZ, JL and HX: overall supervising and organising the study.
Funding HX was supported by the National Natural Science Foundation of China (Grant 31821003) and the China Ministry of Science and Technology (Grant 2018AAA0100300).
Competing interests None declared.
Patient and public involvement Patients and/or the public were not involved in the design, or conduct, or reporting, or dissemination plans of this research.
Patient consent for publication Not required.
Ethics approval There is no direct involvement of human subjects in this project. All the data use existing deidentified biological samples and data from prior studies. Therefore, ethical oversight and patient consent were not handled in this study.
Provenance and peer review Not commissioned; externally peer reviewed.
Data availability statement Single cell data can be obtained in Human Cell Atalas accession code PRJEB31843 (https://data.humancellatlas.org/explore/projects/c4077b3c-5c98-4d26-a614-246d12c2e5d7),Gene Expression Omnibus(GSE134520 and GSE134809) and Single Cell Portal accession code SCP259(https://singlecell.broadinstitute.org/single_cell/study/SCP259/intra-and-inter-cellular-rewiring-of-the-human-colon-during-ulcerative-colitis). All data relevant to the study are descripted in detail in the article or uploaded as supplementary information.