Article Text

Abstract
Objectives: To produce an easily understood and accessible tool for use by researchers in diagnostic studies. Diagnostic studies should have sample size calculations performed, but in practice, they are performed infrequently. This may be due to a reluctance on the part of researchers to use mathematical formulae.
Methods: Using a spreadsheet, we derived nomograms for calculating the number of patients required to determine the precision of a test’s sensitivity or specificity.
Results: The nomograms could be easily used to determine the sensitivity and specificity of a test.
Conclusions: In addition to being easy to use, the nomogram allows deduction of a missing parameter (number of patients, confidence intervals, prevalence, or sensitivity/specificity) if the other three are known. The nomogram can also be used retrospectively by the reader of published research as a rough estimating tool for sample size calculations.
- diagnosis
- nomogram
- power
- sample size
- sensitivity
Statistics from Altmetric.com
In a previous paper,1 we described a method of calculating sample size in diagnostic tests by determining the precision of the expected sensitivity and specificity. However, our experience suggests that many colleagues are reluctant to use the mathematical formula we described. Nomograms have been used in trials of therapy to aid calculation and understanding. The nomogram designed by Gore2 for trials of therapy is an example of an easily understood and accessible tool that can be used by reader and researcher alike.
Sample size estimation in diagnostic tests may take two forms.4 Firstly, the number of subjects needed to test the hypothesis that a particular parameter will exceed a predetermined level can be estimated (that is, is the sensitivity of the new test within 10% of the reference test?). This formal statistical approach is used when the researcher needs to specify equivalence or the difference between two tests.
Secondly, the number of subjects needed to define an expected level of sensitivity and specificity together with the precision of that estimate (that is, the confidence intervals) can be calculated. The mathematical approach differs depending upon whether the researcher is estimating precision (the second method) or testing a hypothesis (the first method). The methods described here are taken from the work by Buderer and are based on the researcher estimating the number of patients required to determine the precision of the result.3
We sought to develop a similar nomogram to estimate sample size in diagnostic trials based upon determination of sample size precision. We present nomograms for the prospective calculation of sample size in studies evaluating single diagnostic tests.
METHODS
Derivation of the nomogram
The calculations by Buderer3 were used to plot the nomogram. These calculations were described in detail in our previous paper.1 In order to simplify the nomogram, and by convention, we fixed the probability of finding a false positive result at 5% or less. This figure is taken at the conventional level from therapeutic studies; no agreed convention currently exists for diagnostic tests. The nomograms were created using a Microsoft Excel spreadsheet.
This method should only be used if more than five subjects have each possible outcome (true positive, false positive, true negative, false negative).
RESULTS
Use of the nomograms
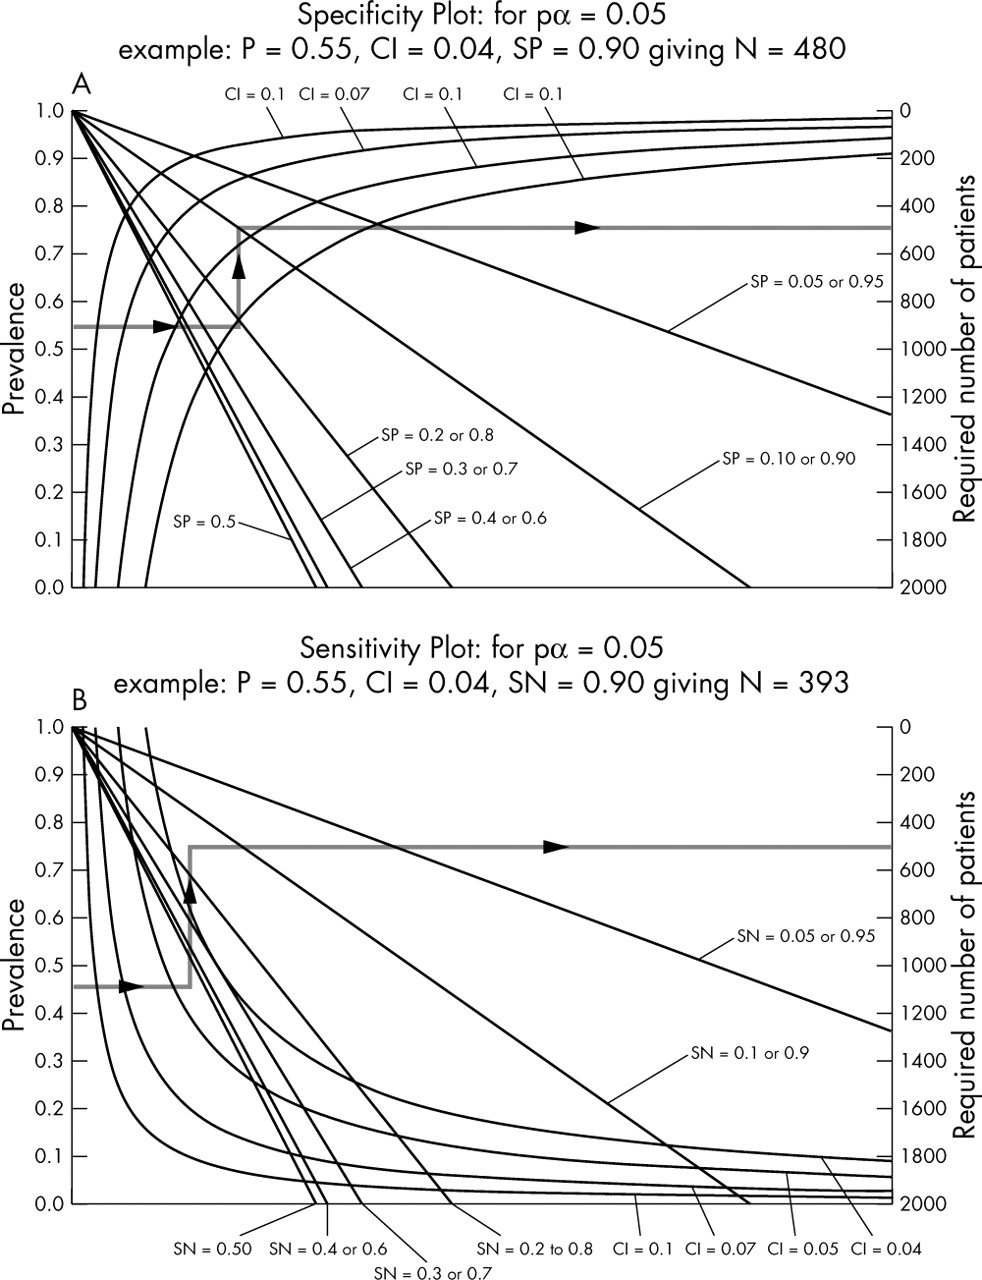
Fig 1 shows nomograms for the calculation of sensitivity (A) and specificity (B). For both nomograms the following method is used.

(A) Specificity plot for pα = 0.05. Example: P = 0.55, CI = 0.04, SP = 0.90 giving n = 480. (B) Sensitivity plot for pα = 0.05. Example: P = 0.55, CI = 0.04, SP = 0.90 giving n = 393. A larger version of fig 1 is available on the EMJ website (http://emjonline.com/supplemental).
-
Use a straight edge to draw a horizontal line from the estimated prevalence to the required confidence interval (for example you estimate that a test has 80% sensitivity; you want to have a fairly precise estimate and so set your confidence intervals for 5%).
-
Draw a line from that intersection vertically until it meets the expected sensitivity or specificity.
-
Draw a horizontal line from that intersection to the right hand axis where the number of patients required may be estimated.
An example of how to use the nomograms is shown as a grey, arrowed line. Simple movement of the rule between different values on each axis can illustrate how a change in any single parameter may influence the precision of the results.
DISCUSSION
The nomogram has four elements to it (number of patients, confidence intervals, prevalence and sensitivity/specificity). If the researcher knows any three of these, they will be able to estimate the fourth. This allows the nomogram to be used retrospectively by the reader of published research as a rough estimating tool for sample size calculations. However, we must again stress the importance of the a priori sample size calculation when planning a study.
Supplementary materials
Erratum Please note that there is an error in the example line given on the specificity nomogram (figure 1 part B) in this article. The calculation lines on the nomogram are correct but the worked example given clearly does not meet the calculating lines. The correct example can be seen in the larger version of the nomogram at http://emj.bmjjournals.com/cgi/content/full/22/3/180/DC1?ck=nck . It should be noted that the error only affects the example and not the underlying nomogram itself.
Figure 1: Larger version
A larger version of figure 1 is available here.Figure 1 (A) Specificity plot for pα = 0.05. Example: P = 0.55, CI = 0.04, SP = 0.90 giving n = 480.

Figure 1 (B) Sensitivity plot for ppα = 0.05. Example: P = 0.55, CI = 0.04, SP = 0.90 giving n = 393.

Files in this Data Supplement:
Footnotes
-
Competing interests: none declared
Linked Articles
- Correction