Article Text

Abstract
Background: Recent reports indicate that prostate cancers (CaP) frequently over-express the potential oncogenes, ERG or ETV1. Many cases have chromosomal rearrangements leading to the fusion of the 5′ end of the androgen-regulated serine protease TMPRSS2 (21q22.2) to the 3′ end of either ERG (21q22.3) or ETV1 (7p21.3). The consequence of these rearrangements is aberrant androgen receptor-driven expression of the potential oncogenes, ETV1 or ERG.
Aim: To determine the frequency of rearrangements involving TMPRSS2, ERG, or ETV1 genes in CaP of varying Gleason grades through fluorescence in situ hybridisation (FISH) on CaP tissue microarrays (TMAs).
Methods: Two independent assays, a TMPRSS2 break-apart assay and a three-colour gene fusion FISH assay were applied to TMAs. FISH positive cases were confirmed by reverse transcriptase (RT) PCR and DNA sequence analysis.
Results: A total of 106/196 (54.1%) cases were analysed by FISH. None of the five benign prostatic hyperplasia cases analysed exhibited these gene rearrangements. TMPRSS2:ERG fusion was found more frequently in moderate to poorly differentiated tumours (35/86, 40.7%) than in well differentiated tumours (1/15, 6.7%, p = 0.017). TMPRSS2:ETV1 gene fusions were not detected in any of the cases tested. TMPRSS2:ERG fusion product was verified by RT-PCR followed by DNA sequencing in 7/7 randomly selected positive cases analysed.
Conclusion: This study indicates that TMPRSS2:ERG gene rearrangements in CaP may be used as a diagnostic tool to identify prognostically relevant sub-classifications of these cancers.
- gene fusion
- TMPRSS2:ERG
- prostate cancer
- FISH
Statistics from Altmetric.com
Prostate cancer (CaP) is the most frequently diagnosed non-skin cancer in America and is a leading cause of cancer-related deaths of men worldwide. In 2006, it was estimated that 234 460 men would be diagnosed with CaP, and about 27 300 American men would die from the disease.1
For over 30 years, genetic rearrangements have been recognised as key events in cancer development. Many haematological malignancies and sarcomas are characterised by common, recurrent chromosomal translocations that lead to expression of fusion genes or deregulation of oncogenes.2 In contrast, epithelial carcinomas show many non-specific chromosomal rearrangements and, until recently, recurrent translocations were not considered to play a major role.3
CaP has historically been associated with many non-specific chromosomal abnormalities instead of common, recurring rearrangements. These include gains at chromosomes 1q, 2p, 7, 8q, 18q, and Xq; losses at chromosomes 1p, 6q, 8p, 10q, 13q, 16q, and 18q; and identification of probable prostate tumour suppressor candidate genes such as NKX3.1, PTEN, and CDH1.4–7
This view is being challenged by recent reports that CaP frequently over-express the ETS family members ETV1 and ERG, and that as many as 80% (23/29) of such CaP have chromosomal rearrangements that lead to the fusion of the 5′ end of the androgen-regulated serine protease TMPRSS2 (21q22.2) to the 3′ end of either ERG (21q22.3) or ETV1 (7p21.3).8 9 The consequence of these rearrangements is aberrant androgen receptor-driven expression of the potential oncogenes, ERG or ETV1.
These gene fusion events were examined initially by Tomlins et al, and have since been confirmed by others.10 11 More recently, Wang et al showed that 59% (35/59) of clinically localised CaP express the TMPRSS2:ERG fusion mRNA and that one fusion isoform in particular correlated with aggressive disease.12 However, they did not find any statistically significant association with other pathological parameters including Gleason score. Perner et al also recently confirmed the presence of these gene rearrangements in 49.2% of 118 primary CaP using fluorescence in situ hybridisation (FISH) on CaP tissue microarrays (TMAs) and showed a significant association between TMPRSS2:ERG rearranged tumours and higher tumour stage and presence of metastatic disease involving pelvic lymph nodes.13 However, they too could not observe a significant association between Gleason grade and TMPRSS2:ERG status.
Nearly 40 years after its inception, Gleason grading system is by far the most powerful prognostic predictor in CaP.14 Thus, we decided to validate this gene fusion event and assess its relationship to disease prognosis through large-scale analysis of unselected CaP samples (n = 196) with varying Gleason pattern. To this end, we have performed FISH analysis on CaP TMAs to determine whether this gene rearrangement can be used to stratify CaP according to the disease severity and link it with clinical outcome.
MATERIALS AND METHODS
Tissue microarray construction
A total of 672 cores from 196 radical prostatectomy specimens at Vancouver General Hospital were used to build the TMAs. Out of these, 84 tumours had 4 cores per case and 112 tumours had 3 cores per case represented on the TMAs. There were on an average 2 (range 1–4) assessable cores per case. H&E stained slides were reviewed for each case. Areas containing tumour tissue were marked on both the slides and corresponding paraffin blocks for TMA construction. Five cases of benign prostatic hyperplasia were also included in the TMA. Gleason pattern was assigned to each individual core that was used for building the TMAs by a pathologist. Reassessment of grade in a contiguous H&E stained TMA section assured the presence of CaP and the fidelity of the intended TMA core. Slides were also stained with basal cell markers cytokeratin 18 (CK18), cytokeratin 5/6 (CK56) and alpha-methyl coenzyme A racemase (AMACR) to confirm the presence of tumour and to segregate cases with Gleason pattern 2 from adenosis. The stained slides were scanned with a BLISS automated digital imaging microscope (Bacus Laboratories, Lombard, IL, USA) and can be viewed at http://bliss.gpec.ubc.ca/ (TMPRSS2:ERG folder). The TMAs were constructed using a manual arrayer (Beecher Instruments, Inc., Silver Springs, MD, USA) with tissue core diameters of 0.6 mm per case.15 16
Fluorescence in situ hybridisation
TMA cores were assayed for FISH TMPRSS2 break-apart along with FISH TMPRSS2:ERG fusion. Sections (6 μm thick) were pretreated as described previously.17 FISH assays were performed using BACs from Human BAC library RPC1-11 (BACPAC Resources Centre, Children’s Hospital, Oakland Research Institute). Table 1 and fig 1 show the locations and size details of the BAC probes used for the TMPRSS2: ERG fusion and the TMPRSS2 break-apart assays.
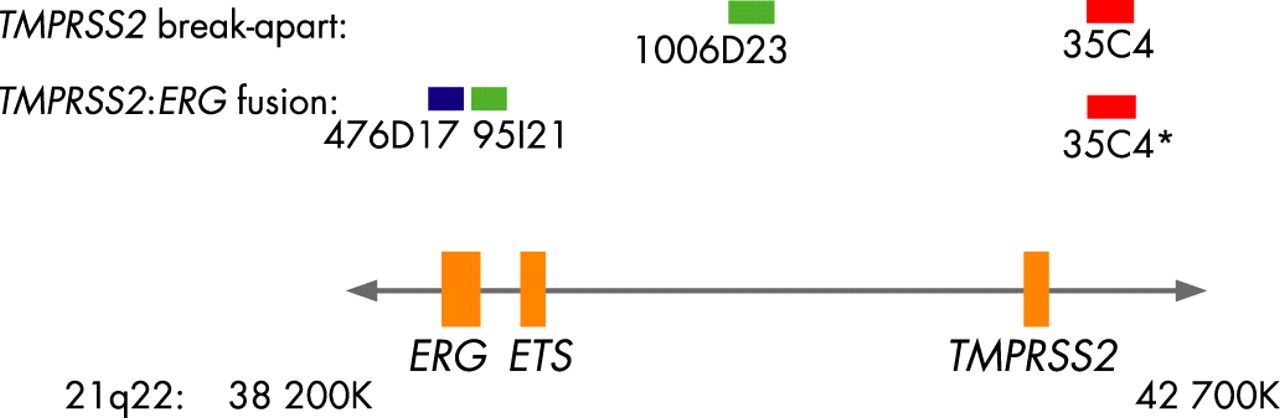
All the above BAC probes were designed based on the Tomlins et al report, except the BAC probe RP11-1006D23 which was used in the FISH TMPRSS2 break-apart assay.9 The chromosomal location for each BAC was validated using normal metaphases (results not shown). Labelling of BAC probes and FISH methods have been described previously.17 18
BACs were either directly labelled with Spectrum Green or Spectrum Orange (Vysis, IL, USA) or indirectly labelled with Streptavidin-Cy5 (MetaSystems Group Inc., Belmont, MA, USA) following biotinylation (BioPrime DNA Labelling System, Invitrogen Life Technologies, Burlington, Ontario, Canada). Probe labelling and FISH were performed using Vysis or MetaSystems reagents according to manufacturers’ protocols.
FISH TMPRSS2 break-apart assays were performed with Spectrum Orange (red) and Spectrum Green (green) fluorophores using two-colour fluorescence. A break in the TMPRSS2 gene was determined by separation between the Spectrum Orange (BAC RP11-35C4) and Spectrum Green (BAC RP11-1006D23) FISH signals (fig 2). The FISH TMPRSS2:ERG fusion assay was performed using three-colour fluorescence: Cy5 (blue), Spectrum Green (green), Spectrum Orange (red). Tissue cores positive for genetic rearrangements involving fusion between the TMPRSS2 and ERG genes were determined by loss of the green signal corresponding to the 5′ end of ERG (BAC RP11-95121) and a resulting fusion between the blue signal corresponding to the 3′ end of ERG (BAC RP11-476D17) and red signal corresponding to the 5′ end of TMPRSS2 (BAC RP11-35C4) (fig 2). Cases that had abnormal TMPRSS2 break-apart results but were not positive for TMPRSS2:ERG gene fusions were assayed for TMPRSS2:ETVI, TMPRSS2:ETV4 and TMPRSS2:FLI-1 gene fusions. The BAC probes used for these assays were RP11-124L22 (Cy5) and RP11-483J3 (Spectrum Green) for ETVI; RP11-100E5 (Cy5) and RP11-147C10 (Spectrum Green) for ETV4; and a combination of RP11-432LI3 and RP11-1079A6 (both in Spectrum Green) and RP11-75P14 (Cy5) for FLI-1. These probes were used in conjunction with the RP11-35C4 (Spectrum Orange) TMPRSS2 BAC probe to detect gene fusions.

Analysis was done on a Zeiss Axioplan epifluorescent microscope. Images were captured using Metasystems Isis FISH imaging software (MetaSystems Group, Inc.).
RT-PCR
Seven samples that were positive for FISH TMPRSS2:ERG gene fusion and five FISH negative samples were randomly selected for validation using reverse transcriptase-PCR (RT-PCR) to characterise the translocation breakpoint. Total RNA was extracted from two or three 1.5 mm paraffin-embedded TMA cores, as previously reported.19 Genomic DNA was removed by treatment with DNase I (Invitrogen, Carlsbad, CA, USA), and cDNA was synthesised from 2 μg total RNA with MMLV (Invitrogen). RNA quality was assessed by GAPDH gene amplification. PCR amplification of cDNA using the primers 5′-TAG GCG CGA GCT AAG CAG GAG-3′ and 5′-GTA GGC ACA CTC AAA CAA CGA CTG G-3′ was used to detect the TMPRSS2:ERG translocation RT-PCR fusion product.9 PCR amplicons were separated on a 2% agarose gel. Samples 477, 582, 514, 445, 791, 150 and 083 were positive by FISH assay, whereas samples 147, 208, 567, 712 and 565 were negative by FISH assay (fig 3A).

Sequence analysis
Amplification products corresponding to the TMPRSS2:ERG translocation were cloned into the pCR2.1-TOPO vector (Invitrogen, Carlsbad, CA) and sequenced bi-directionally using M13 forward (−20) and M13 reverse primers (Invitrogen), the BigDye Terminator chemistry and an ABI Prism 3100 automated DNA sequencer (Applied Biosystems, Foster City, CA, USA). Nucleotide numbering of the TMPRSS2 gene is based on cDNA sequence with GenBank accession number NM_005656, whereas that of the ERG gene is based on cDNA sequence with GenBank accession number NM_004449. The smaller TMPRSS2:ERG RT-PCR fusion product with exon 1 of TMPRSS2 contiguous with exon 4 of ERG would require a different ATG site within exon 4 of ERG. Alternatively, the larger product including exons 1 and 2 of TMPRSS2 and exon 4 of ERG would require the ATG site located in the exon 2 of TMPRSS2 (fig 3B).
Statistical analysis
Statistical analysis was performed using SPSS V.11.0 for Windows (SPSS Inc., Chicago, IL, USA). All tests were two-sided and used a 5% alpha level to determine significance.
RESULTS
Tumour material from 196 cases was used to build the CaP TMAs. After accounting for the cores that dropped out while sectioning and FISH assay failure, only 112 cases (57.1%) had more than 50 epithelial nuclei giving clear FISH signals and were deemed scorable (table 2). Of these 112 cases, 6 samples with missing Gleason pattern data were excluded from data analysis, bringing the final number of cases to 106.
All the cases that scored positive for the FISH TMPRSS2:ERG fusion assay were also determined to be positive by FISH TMPRSS2 break-apart assay. Among the 36 FISH TMPRSS2:ERG fusion positive cases, we looked at the frequency of deletion of the green signal corresponding to the 5′ end of ERG (BAC RP11-95121) probe. FISH TMPRSS2:ERG fusion was associated with deletion of 5′ ERG probe in 21/36 (58.3%) cases. There was evidence of FISH TMPRSS2:ERG fusion without the deletion of 5′ ERG probe in 11/36 (30.6%) cases. In 4/36 (11.1%) cases, the status of 5′ ERG probe could not be determined.
RT-PCR analysis followed by sequencing of the PCR products after cloning showed that all seven samples that were positive for the FISH TMPRSS2:ERG fusions carried a fusion of the complete exon 1 of TMPRSS2 with the beginning of exon 4 of ERG (fig 3). This is the same fusion product that was previously described in MET28-LN, an ERG over-expressing lymph node metastasis cell line from a CaP patient.9 Of the seven positive samples showing FISH TMPRSS2:ERG fusions, four samples (fig 3) showed a recently described second transcript, arising from the fusion of exon 1 and 2 of TMPRSS2 with the beginning of exon 4 of ERG.10 No PCR product was amplified from four of the five samples that were negative for FISH TMPRSS2:ERG fusions.
We further determined whether the TMPRSS2:ERG fusion event corresponded to CaP Gleason pattern. None of the five benign prostatic hyperplasia samples were positive for this gene fusion. Among the well-differentiated tumours, only 1 of 15 (6.7%) Gleason pattern 2 CaP specimens was found to carry a FISH TMPRSS2:ERG fusion, whereas 35 of the 86 (40.7%) moderate to poorly differentiated CaP cases representing Gleason patterns 3–5 were positive for FISH TMPRSS2:ERG fusion (p = 0.017 by Fisher’s exact test, n = 106) (table 2). While we did not find a correlation between the presence and absence of the FISH TMPRSS2:ERG gene fusion and either median prostate specific antigen (PSA) levels or disease recurrence, our results indicate that this fusion event was more common among the moderate to poorly differentiated CaP. Although we did not have the complete clinical follow-up data on all the evaluated cases, table 3 shows clinical and pathological parameters on the available cases.
In addition to the 36 fusion positive cases described, 5 cases had abnormal TMPRSS2 FISH break-apart results but were not positive for FISH TMPRSS2:ERG fusions. Such results indicate that fusion events between TMPRSS2 and other genes are possible. To investigate whether these TMPRSS2 breaks are associated with fusion to other ETS family transcription factors, we performed FISH fusion assays for TMPRSS2:ETV1, TMPRSS2:ETV4 and TMPRSS2:FLI1 fusions. ETV1 has already been described as involved in CaP translocations with TMPRSS2, and is also involved in Ewing’s sarcoma.9 20 Recently a rare third molecular subtype of CaP was identified, characterised by fusion of TMPRSS2 with ETV4.21 FLI-1, like ERG and ETV1, is also a member of the ETS family of transcription factors and is rearranged in 95% of Ewing’s sarcomas.20 We were not able to detect FISH fusions between TMPRSS2 and ETV1, ETV4 or FLI-1 in any of these five cases with abnormal FISH TMPRSS2 break-apart results.
DISCUSSION
Malignant transformation of the prostate and progression of carcinoma appear to be the consequence of a complex series of initiation and promotional events under genetic and environmental influences. Our current inability to differentiate men who require aggressive management of prostate cancer from men with indolent disease for whom more conservative approaches would suffice remains a major challenge.22 23 To this end, numerous studies have been undertaken to identify new prognostically relevant diagnostic markers for high risk CaP.
One area of particular recent interest is the relationship of ETS transcription family member expression in CaP. A study analysing laser microdissected paired benign and malignant prostate epithelial cells from CaP found ERG as the most frequently over-expressed proto-oncogene in the transcriptome of malignant prostate epithelial cells.8 TMPRSS2:ERG fusion product was found by other groups in 14 of 18 prostate adenocarcinoma biopsies by nested RT-PCR method and in 6 of 15 CaP by RT-PCR and FISH, further confirming the presence of this gene fusion in CaP.10 11 Similarly, two recent reports show association between the presence of these gene rearrangements and aggressive disease and higher tumour stage.12 13 In this report, we confirm the overall frequency of TMPRSS2:ERG fusion events in CaP and go on to show for the first time that TMPRSS2:ERG fusion is preferentially associated with moderate to poorly differentiated CaP.
TMPRSS2 expression was reported by Vaarala et al to be higher in CaP cells compared to benign cells in 84% of specimens (n = 32) and in poorly differentiated primary prostate adenocarcinomas (p = 0.014, n = 7).24 TMPRSS2 is a type II transmembrane serine protease that translocates from the surface of the cell to the extracellular space on activation. It is an androgen-regulated gene whose product is preferentially expressed in normal prostate tissue and is over-expressed in neoplastic prostate epithelium.24 The TMPRSS2 upstream regulatory elements provide a robust androgen-responsive transcriptional control module to which potential oncogenes may be transposed.
One such potential oncogene is ERG, a member of the ETS family, characterised to respond to mitogenic and/or stress signals transduced by various MAP kinases, and modulate transcription of target genes favouring tumourigenesis.8 ERG is expressed in endothelial cells (microvessels) of the stroma in a small proportion of CaP. Chromosomal translocations involving ERG were found in Ewing sarcoma, myeloid leukemia, and cervical carcinoma.25 26 When taken together, our results and the results of other groups strongly imply that translocation of the TMPRSS2 regulatory regions to the open reading frame of ERG is a frequent event in CaP pathogenesis.8–13 This translocation may be selected for its ability to promote strong positive dysregulation of ERG expression. Since ERG is a known oncogene in Ewing’s sarcoma, it stands to reason that constitutive elevated expression of ERG by CaP may prove to be a critical oncogenic lesion that promotes establishment of high-grade adenocarcinomas.
Additionally, in our study, we unexpectedly found that one of the TMPRSS2:ERG fusion negative sample (#712) by FISH was positive for the TMPRSS2:ERG fusion gene by RT-PCR (fig 3A). Repeat FISH analysis of the whole section with attention paid to the areas adjacent to the core used for RNA extraction was also negative. In another case (#208) that was negative by both FISH and RT-PCR, further analysis of a separate non-contiguous tissue block with CaP showed positivity by both assays. These observations suggest that multi-focal malignant clones in CaP may be distinguished by the presence of these rearrangements. CaP is a multifocal and heterogeneous disease with extensive histological heterogeneity even among foci within the same tumour.27 Clark et al have recently reported similar findings in their report detailing the diversity of TMPRSS2:ERG hybrid transcripts in human prostate samples.28 The authors found that only 19/26 (73%) CaP samples showed the presence of a TMPRSS2:ERG RT-PCR fusion product, whereas 8/17 (43%) normal prostate samples also harboured the TMPRSS2:ERG RT-PCR fusion transcripts in the non-malignant area. They also looked at 10 paired samples of non-malignant and cancer tissues from the same prostate and found that two non-malignant specimens tested positive for the TMPRSS2:ERG RT-PCR fusion product. Such features raise the possibility that a microscopic focus of TMPRSS2:ERG fusion positive CaP within the core used for RT-PCR would explain the false negative FISH result in sample #712. This potential ability of RT-PCR to identify TMPRSS2:ERG fusion positive clones within the background of TMPRSS2:ERG fusion FISH negative cases could explain, at least in part, the differences in frequency of results between us (39.5%) and Soller et al (78%) and Wang et al (59%).10 12 In addition the above mentioned studies used RNA extracted from freshly-frozen CaP samples for the nested RT-PCR experiments which is very sensitive in picking up fusion transcripts expressed at low levels. In contrast, here the RNA was extracted from FFPE CaP tissue matched to the FISH samples. This approach however yields poorer quality RNA and thus must be considered a limitation of the present study. Another point to be noted is that our reference gene, GAPDH, is highly expressed in all tissues which could have yielded false negative results for the TMPRSS2:ERG fusion products. For this reason, the possibility that some TMPRSS2:ERG fusion transcripts present at very low levels in FISH negative CaP cores have been missed by RT-PCR cannot be excluded, although this hypothesis is improbable as RT-PCR was able to detect easily the TMPRSS2:ERG fusion transcript in FISH positive cases. We also would like to mention the limitations of the FISH assay in the same context. Performing the FISH assay on TMAs presents similar limitations as sectioning can result in the truncation of nuclei; this could lead to loss of signal and false positives.
We did not find evidence for TMPRSS2:ETV1 gene fusions in any of the CaP samples analysed. This is in agreement with the results of other groups.10 11 13 However Tomlins et al described this rearrangement in 25% (7/25) of CaP samples.9 Our study thus confirms that ETV1 rearrangement is indeed a rare event in CaP pathogenesis. This approach would not detect other ETV1 rearrangements such as those that have recently been reported in CaP cell lines.29 We also ruled out TMPRSS2:FLI-1 and TMPRSS2:ETV4 gene fusion in a limited number of cases in this study. Iljin et al recently reported TMPRSS2:ETV4 RT-PCR fusion product in 1/18 (5.6%) advanced CaP, suggesting that this fusion product is also relatively rare.30 Hermans et al looked at 11 xenografts representing different stages of CaP and found that in all late-stage androgen-receptor negative CaP samples, there was over-expression of wild type ETV4 or FLI-1, not resulting from the fusion with other genes.31 Our observation of five cases containing TMPRSS2 chromosomal rearrangements not associated with fusion to the ETS family members, ERG, ETV1, ETV4 or FLI-1, suggests the possibility that the fusion of this androgen responsive promoter with other proto-oncogenes may also be clinically relevant.
We found no correlation between Gleason grade and serum PSA levels in the cases positive for the gene rearrangements. This is not surprising, since over the last 20 years, median serum PSA levels have only been related to prostate size and do not correlate with increased Gleason grade.32 We also saw no correlation between the presence of these gene rearrangements and disease outcome due to the limited number of cases that have subsequently relapsed. This is an ongoing study with only recent follow-up data and very few cases of recurrences. Long term follow-up and increased cases will be required to determine the clinical consequences of these gene fusions and is beyond the scope of the present study.
Take-home messages
Gene fusions between TMPRSS2 and ETS family members, ERG and ETV1, have recently been described in prostate cancer.
TMPRSS2:ERG fusion product is found more often in moderate to poorly differentiated prostate cancer (CaP) compared to well differentiated CaP.
This finding has the potential to risk-stratify CaP in a clinically meaningful manner.
As in the case of chronic myelogenous leukaemia (CML), these fusion genes can be the target of future therapeutic strategy for the treatment of CaP. However, there is no chimeric fusion product as in the case of CML since the TMPRSS2 component is in the 5′ non-translated region of the gene.
When diagnosed and treated early, CaP has a cure rate of over 90%. However, determining what fraction of these cases were likely to become life-threatening, and what fraction would have not impacted longevity or quality of life if treated in another manner or even left untreated, remains unknown. Identifying molecular markers of CaP that better predict disease course are paramount to improving patient treatment options. Since most CaP are androgen dependent, finding co-activators and co-repressors involved in the regulation of androgen receptor-driven transcription of CaP will be a key to development of targeted therapy.33 The identification of translocations involving androgen receptor-driven expression of the potential oncogene ERG could stratify CaP into risk groups and ultimately advance its diagnosis and treatment.
REFERENCES
Footnotes
Funding: This work was supported in part by the Canadian Institutes of Health Research Strategic Training Program (Grant STP-53912). The Genetic Pathology Evaluation Centre is supported by an educational grant from Sanofi-Aventis, Canada. D Huntsman and M Cox are Michael Smith Health Foundation for Research Scholars. A De Luca is a recipient of the Michael Smith Health Foundation for Research post-doctoral award and J Palmer is supported in part by the British Columbia Foundation for Prostate Cancer Research.
Competing interests: None declared.
- Abbreviations:
- CaP
- prostate cancer
- FISH
- fluorescence in situ hybridisation
- PSA
- prostate specific antigen
- TMA
- tissue microarray
Linked Articles
- Molecular pathology