Article Text

Abstract
Aims The lack of accepted scoring criteria has precluded the use of p53 in routine practice. We evaluate the utility of automated quantitative p53 analysis in risk stratifying Barrett’s oesophagus (BE) patients using non-dysplastic BE (NDBE) biopsies in a multicentric cohort of BE progressor (P) and non-progressor (NP) patients.
Methods NDBE biopsies prior to the diagnosis of advanced neoplasia from 75 BE-P, and index and last surveillance biopsies from 148 BE-NP were stained for p53, and scored digitally as 1+, 2+ and 3+. A secondary cohort of 30 BE-P was evaluated.
Results Compared with BE-NP, BE-P was predominantly men (p=0.001), ≥55 years of age (p=0.008), with longer BE segments (71% vs 33%; p<0.001). The mean number of 3+p53 positive cells and 3+ positive glands were significantly more in BE-P versus BE-NP NDBE biopsies (175 vs 9.7, p<0.001; 9.8 vs 0.1; p<0.001, respectively). At a cut-off of ≥10 p53 (3+) positive cells, the sensitivity and specificity of the assay to identify BE-P were 39% and 93%. On multivariate analysis, scoring p53 in NDBE biopsies, age, gender and length of BE were significantly associated with neoplastic progression. 54% of patients classified as prevalent dysplasia showed an abnormal p53 immunohistochemical stain. These findings were validated in the secondary cohort.
Conclusions Automated p53 analysis in NDBE biopsies serves as a promising tool for assessing BE neoplastic progression and risk stratification. Our study highlights the practical applicability of p53 assay to routine surveillance practice and its ability to detect prevalent dysplasia.
- Barrett Esophagus
- Gastrointestinal Neoplasms
- IMMUNOHISTOCHEMISTRY
Data availability statement
Data are available on reasonable request. Data, analytical methods and study materials will be made available to other researchers on request.
Statistics from Altmetric.com
WHAT IS ALREADY KNOWN ON THIS TOPIC
Only a fraction of patients with Barrett’s oesophagus (BE) progress to high-grade dysplasia/adenocarcinoma and 85% of adenocarcinomas in these patients are classified as prevalent.
Histological detection of dysplasia is the gold standard for risk stratification.
WHAT THIS STUDY ADDS
Automated p53 analysis in non-dysplastic BE biopsies distinguishes BE progressors from non-progressors.
An abnormal p53 immunohistochemical stain can identify 54% of patients with advanced prevalent BE-related neoplasia.
HOW THIS STUDY MIGHT AFFECT RESEARCH, PRACTICE OR POLICY
Detecting abnormal p53 by immunostaining is a promising tool for predicting BE-related neoplastic progression.
This study highlights the practical applicability of p53 assay to routine surveillance practice and the stain could aid in the detection of prevalent dysplasia.
Introduction
Oesophageal adenocarcinoma (EAC) is an aggressive disease with a mean 5-year survival rate of only 15%.1 Most EACs arise in the setting of Barrett’s oesophagus (BE), a metaplastic epithelium that forms in response to chronic reflux injury. Despite a high prevalence rate of 1.6%–11% in adult patients, the annual risk of cancer progression in non-dysplastic BE (NDBE) is low, estimated to 0.2–0.5 per year.2 3 This challenges the current screening paradigms in terms of selecting and treating patients who are at a higher risk of developing EAC.2
There is no gold standard test for predicting risk of neoplastic transformation in NDBE that can be readily applied to clinical practice. Histological assessment of dysplasia remains the standard of care for risk stratification. However, this approach has several limitations: (1) the high prevalence of NDBE, (2) high rates of interobserver variability among pathologists to diagnose dysplasia,4–6 (3) sampling error, especially in long segment BE that can harbour endoscopically invisible lesions, (4) lack of adherence to biopsy protocol in longer segments of BE,7 (5) absence of widely accepted ancillary tests that could identify high risk NDBE patients and (6) financial burden on the healthcare system due to the need to survey large populations with frequent, invasive and costly endoscopic procedures. Furthermore, there are data to suggest that continued endoscopic surveillance in patients with persistent NDBE may not be associated with a substantially decreased risk of mortality from EAC. These are predicated on detecting molecular alterations in limited biopsy and/or cytology samples that often predate the advent of dysplasia and may prove to be a more robust methodology of identifying and stratifying BE patients who are at a significantly higher risk of neoplastic progression.4
Recent pan-cancer studies from The Cancer Genome Atlas and International Cancer Genome Consortium have shown that TP53 mutations occur as a clonal driver in EAC and these alterations usually occur as an early carcinogenic event. However, there are very few studies evaluating TP53 alterations in NDBE and the results have not been consistent, with many studies suggesting that TP53 mutations are either absent or rare in NDBE.5–8 Additionally, there are many cross-sectional studies of genetic alterations in EAC but fewer longitudinal studies in patients with BE examining these alterations prior to the advent of dysplasia.9–11 All of these studies essentially confirm that aberrant p53 expression is associated with a significantly increased risk of developing high-grade dysplasia (HGD) or EAC. The American College of Gastroenterology, while acknowledging the value of p53 stain, does not endorse routine use of p53 for supporting the diagnosis of dysplasia or as a risk stratification tool.2 A recent meta-analysis concluded that among adults with NDBE (or BE with low-grade dysplasia), 25% of EACs are diagnosed within 1 year after the index endoscopy.12 Thus, an opportunity for early intervention in a significant proportion of EACs (and HGD) would be missed if the current guidelines of a repeat endoscopy every 3–5 years is followed.
It is thus notable that although the existing literature strongly supports the role of p53 as a biomarker for high risk NDBE patients, there are several challenges that preclude the use of p53 immunohistochemistry in clinical practice: (1) variable definition of an abnormal p53 immunostaining and (2) highly subjective semiquantitative scoring systems. To potentially circumvent some of these interpretation-related challenges, we deploy an automated quantitative approach for assessing p53 expression in the one of the largest multicentric cohort of BE progressors (P).
Material and methods
Study design
We conducted this study with a large retrospective cohort of patients (primary cohort) with biopsy proven NDBE cases that progressed to advanced neoplasia (HGD or EAC) (BE-P) and those who did not (BE non-progressors, NP) (figure 1 illustrates the study design). A second cohort of BE-P (secondary cohort) was also collected as an additional set to validate our findings (figure 1). The diagnosis of BE was confirmed endoscopically and pathologically; the latter defined by the documentation of intestinal metaplasia in sampled specimens. Age at diagnosis, gender, body mass index (BMI), history of smoking and alcohol intake were recorded for all patients. Incident dysplasia was defined as dysplasia detected after an interval of at least 1 year following the initial diagnosis of BE. Prevalent dysplasia was defined as dysplasia detected either at the time of initial biopsy or during the first year of endoscopic surveillance. Patients with dysplasia diagnosed on the first biopsy, biopsies diagnosed as indefinite for dysplasia or where sufficient material was not available for review or additional testing were excluded from the study.

Study design and selection of three groups with Barrett’s oesophagus (BE) examined in this study: (1) progressor, (2) non-progressor, (3) external secondary cohort of progressor patients. MGH, Massachusetts General Hospital, BMC, Boston Medical Centre; BWH, Brigham and Women’s Hospital; HGD, high-grade dysplasia; UCSF, University of California San Francisco.
Selection of primary cohort
BE progressors
Following Institutional Review Board approval, we identified 42 600 patients with oesophageal or gastro-oesophageal biopsies at Massachusetts General Hospital between 1990 and 2018. The progressor cohort was selected by identifying patients who developed HGD/EAC and who had at least one NDBE biopsy prior to the neoplastic biopsy. The final cohort was composed of 75 patients (figure 1). In cases where multiple biopsies from different sites were available, the biopsy from the most distal aspect of BE segment was selected for analysis. This selection was based on data that suggests that a substantial proportion of dysplasia and EAC occurs in the distal oesophagus, close to the gastro-oesophageal junction.13 14 In 41/75 cases, we examined a single NDBE biopsy, in 28/75 cases we evaluated two serial NDBE biopsies and in 6/75 cases we examined 3 serial NDBE biopsies obtained at different time intervals (figure 1). The index biopsy with advanced neoplasia (defined as the first biopsy with a histological diagnosis of HGD/EAC) was reviewed by three gastrointestinal (GI) pathologists (VD, RO and DP), and disagreements were resolved by review at a multiheaded microscope.
BE non-progressors
A total of 148 patients were chosen as the NP cohort. The mean interval between the index biopsy with BE (defined as the first BE biopsy available for analysis; N=148) and the last available BE biopsy was 10 years (range: 2–24 years). BE-NP was matched with the BE-P for body mass index (BMI), smoking and alcohol intake.
Selection of secondary cohort
We also evaluated NDBE biopsies from 30 BE-P patients from four institutions (Brigham and Women’s Hospital, Boston Medical Center, Brown University and University of California San Francisco Medical Center) who progressed to advanced neoplasia (HGD=25 and EAC=5). The index biopsy of advanced neoplasia was confirmed by two GI pathologists (VD and DP).
p53 immunohistochemistry
p53 immunoreactivity was assessed on the following groups of cases within the progressor cohort: (1) NDBE biopsy prior to the diagnosis of advanced neoplasia and (2) the index biopsy with advanced neoplasia. Within the NP cohort, we evaluated: (1) index biopsy with BE and (2) the last available biopsy during ongoing surveillance. p53 (Agilent #M7001, 1:200) immunohistochemistry was performed using an automated staining system (LabVision Autostainer 360, Thermo Scientific, Fremont, California, USA). Briefly, sections were deparaffinised, rehydrated and treated with HIER (10 mM sodium-citrate buffered solutions containing 0.05% Tween at 120°C for 2 min, pH 6.0). After blocking endogenous alkaline phosphatase activity (BLOXALL, Vector Laboratories, Burlingame, California, USA) and with normal horse serum (both for 10 min), sections were incubated with primary antibody for 1 hour followed by secondary ImmPRESS polymer detection systems (Vector Laboratories) according to the manufacturer’s protocol. Subsequently, the Vulcan Fast Red Chromogen Kit 2 (Biocare Medical, Pacheco, California, US) was applied as substrate, and haematoxylin was used as the counterstain. With every batch, a known tissue control was used.
Automated analysis and scoring
Automated analysis for p53 digital images of tissue sections were captured using a Leica Aperio AT2 slide scanner system at ×40 magnification. Images were quantified using VIS (Visiopharm) histopathology image analysis software. Enumeration of 1+ (weak), 2+ (medium) and 3+ (strong) p53 positive columnar cells was performed using VIS app 10 002 ER, modified for p53 stain (figure 2). Strong (3+) p53 expression was defined as reactivity equivalent to or higher than the most strongly positive nuclei in the basal layer of the squamous epithelium. Prior to the automated analysis, squamous regions were excluded by hand annotation (AN).

Non-dysplastic oesophageal biopsy from a patient who progressed to high-grade dysplasia (A). The p53 stain shows occasional strongly positive columnar cells (arrow) (B). Note that the staining intensity of these cells is equivalent to that of the basal squamous epithelial cells with the highest reactivity (arrowhead). However, strongly positive p53 glands are not seen, instead these cells are scattered among multiple glands. The automated analysis identified 32 3+ positive cells (nuclei marked in red, arrowhead) (C). (A) H&E stain; (B, C). p53 stain.
Manual analysis
We also performed manual scoring of p53 expression in NDBE biopsies to compare the predictive power of manual to the automated analysis. Two pathologists (VD and AN), blinded to the outcome and results of automated p53 analysis, performed a quantitative analysis. As there are no criteria to assess p53 scoring in NDBE samples, we defined these cut-offs after analysing the automated scoring data. Of note, a number of p53 positive epithelial cells were assessed in all fragments of the biopsy sample, regardless of whether they were distributed individually or in groups. We also assessed p53 expression at an individual gland level by enumerating the number of glands that were strongly positive for p53. A gland was defined as positive when ≥50% cells showed strong (3+) expression of p53. With regard to biopsies with neoplasia, in addition to assessing strong p53 expression, complete loss of expression was also recorded. Thus, abnormal p53 expression was defined as strong expression or complete absence of p53 staining. Lastly, the presence or absence of strong surface epithelial p53 expression was also documented.
Statistical analysis
Using SPSS software (V.20.0), categorical parameters were analysed by using χ2 test or Fisher’s exact test, and continuous variables were analysed using Mann-Whiney U test. Univariate and multivariate logistic regression models were used to assess independent significance of various clinicopathological and p53 parameters. Receiver operating curve (ROC) analysis was performed to generate the optimum cut-off point for continuous variables including 3+p53 positive columnar cells and 3+p53 positive glands. Interclass agreement between automated and manual scoring was assessed using Cohen’s kappa statistics and Pearson’s correlation. A p<0.05 was considered to be statistically significant.
Results
Clinicopathological parameters
Table 1 shows comparison of the clinicopathological features between progressor and NP groups of the primary cohort. Briefly, compared with the NP group, the progressor group showed a greater proportion of men (84% vs 63%; p=0.001), majority of patients were 55 years or older (76% vs 58%; p=0.008). Similarly, long segment BE was significantly associated with progressors compared with NP (71% vs 33%; p<0.001). Within the progressor group, 36/75 (48%) patients progressed to HGD and 39/75 (52%) to EAC.
Comparison of clinicopathological features among progressor (N=75) and non-progressor patients (N=148)
Analysis of NDBE biopsies in progressor and NP groups of the primary cohort
Table 2 details the comparison of quantitative analysis of p53 in NDBE biopsies from the progressor and NP groups. There was a significant difference in the mean number of 3+p53 positive columnar cells and mean number of 3+p53 positive glands between the two groups (175 vs 9.7, p<0.001; 9.8 vs 0.1; p<0.001, respectively) (figure 2, table 2). Strong p53 (3+) surface epithelial staining was noted exclusively in 7 cases (6%) within the progressor cohort.
Quantitative analysis of p53 immunostaining in BE progressor versus BE non-progressor
In order to distinguish progressor NDBE from NP BE, we used an ROC analysis to identify the optimal cut-points for p53 parameters (figure 3, table 3). A total of 39% of biopsies from BE-P patients and 7% biopsies from BE-NP (OR 8.9, 95% CI 4.2 to 18.7; p<0.001) exceeded a cut-off of ≥10 strongly positive (3+) columnar cells (table 2, figure 2). Twenty-seven per cent of BE-P biopsies showed at least one p53 positive gland compared with 3% of BE-NP biopsies (p<0.001) (table 2, figure 4). These significant associations were maintained when the p53 expression was evaluated using criteria for 2+p53 epithelial staining and a cut-off of 150 cells (table 2). The presence of any of the following features: (1) ≥10 cells showing 3+p53 expression, or (2) at least one 3+ positive gland, or (3) 3+p53 expression within the surface epithelium, was significantly associated with the progressor compared with the NP cohort (48% vs 14%; p<0.001).

Receiver operating curve (ROC) for various parameters including age at presentation, endoscopic length of be, 3+ p53 positive cells, 2+ p53 positive cells, 3+ p53 positive glands and prediction score to discriminate progressor be from non-progressor be. BE, Barrett’s oesophagus.

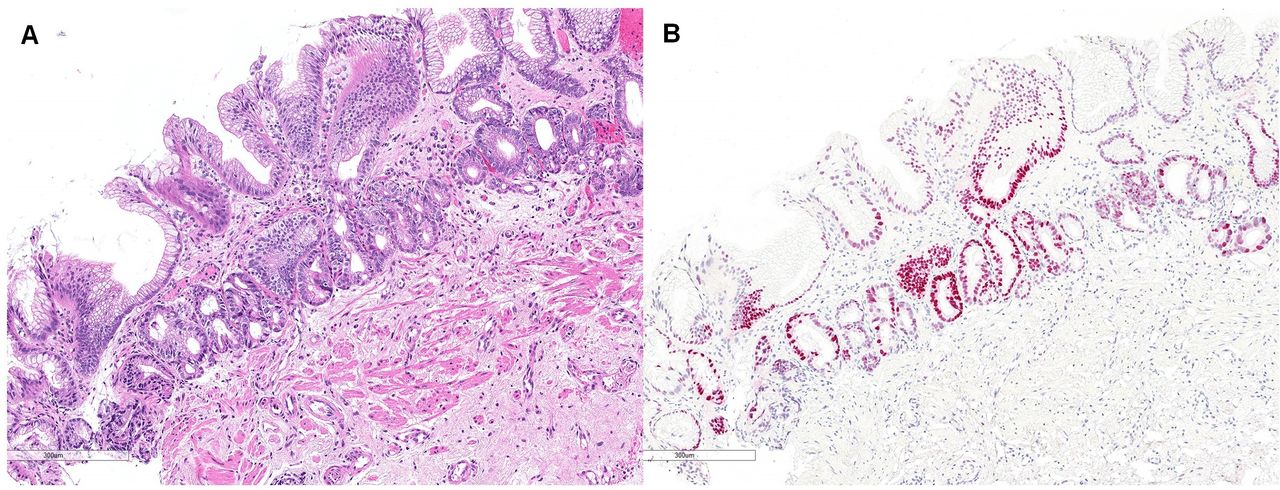
Biopsy with non-dysplastic Barrett’s oesophagus from a patient who progressed to high-grade dysplasia (A). Unlike the image shown in figure 2, multiple strongly (3+) p53 positive glands are noted. (A), H&E stain; (B), p53 stain.
Specificity and sensitivity of p53 immunohistochemistry in distinguishing NDBE biopsies from progressor from non-progressor patients
We also performed a subanalysis to see whether there were any differences in age, gender, endoscopic length of BE and rate of advanced neoplasia among BE-P patients who showed an abnormal p53 stain. Among these parameters, we did notice higher percentage of biopsies with 3+p53 positive columnar cells (50% vs 33.8, p=0.121) and 3+p53 positive glands (37% vs 23%, p=0.165) in short segment BE compared with long segment BE.
Comparison of p53 expression between NDBE biopsies prior to diagnosis of advanced neoplasia (progressor BE)
Among the 75 patients from the progressor group, 28 had 2 sets of NDBE biopsies prior to the diagnosis of advanced neoplasia. Biopsies that were more proximate to the index biopsy with advanced neoplasia showed a higher number of strongly p53 (3+) positive cells (mean=164.5) compared with the first biopsy (mean=74.4); however, this difference was not statistically significant (p=0.131).
Of note, an abnormal p53 expression was observed in all index dysplastic biopsies (online supplemental table 1), supporting the high sensitivity of p53 stain for the diagnosis of HGD/EAC.
Supplemental material
Predictive performance of p53 immunostaining
Figure 5 shows differences in progression to advanced neoplasia between the p53-positive and p53-negative cohort. Based on the ROC analysis (figure 3), assessment of nuclei showing 3+p53 positivity provided the highest level of sensitivity and specificity among the various clinical and p53 parameters studied. At a cut-off at ≥10 3+ p53 positive columnar cells, the assay could identify patients that progressed to advanced neoplasia with a sensitivity and specificity of 39% and 93%, respectively. At a cut-off ≥1 strong p53 (3+) positive glands, specificity was high (97%) but with a lower sensitivity of 27%. With regard to 2+p53 positivity (>150 positive cells), we found a relatively higher sensitivity (70%) and specificity (69%). Strong (3+) reactivity within the surface epithelium was associated with a perfect specificity (100%) but was an insensitive means of predicting progression to advanced neoplasia (6%) (table 3).

Kaplan-Meier curve. (A) Progression-free interval for progression to high-grade dysplasia between high (3+ p53 positive cells) p53 cases (blue) vs low p53 cases (green). Mean progression free duration in years (5.8 vs 15.6, p<0.001). (B) Kaplan-Meier curve. Progression-free interval between high (3+ p53 positive gland) p53 cases (blue) vs low p53 cases (blue). Mean progression-free duration in years (5.3 vs 14.8, p<0.001).
We also evaluated the predictive value of the assay with respect to the length of BE segment and found that the sensitivity and specificity of the p53 assay was higher in patients with short segment BE as compared with long segment BE (50% and 96% vs 34% and 87%; online supplemental table 2A, B) when using the ≥10 cells cut-off.
Development of a prediction scoring system to predict progression to advanced neoplasia
On a multivariate regression analysis, age, gender, length of BE and the two p53 parameters (≥10 3+ p53 positive columnar cells, and ≥1 3+ p53 positive glands) correlated with progression to advanced neoplasia (table 4). Based on HR obtained from multivariate regression analysis, we assigned a numerical value to each of the above parameters, to develop a prediction scoring system that could predict development of advanced neoplasia. The scoring criteria are described in online supplemental table 3. A cumulative score was calculated for every patient with available all five parameters. The cumulative prediction score varied from 5 to 22. Based on the ROC curve analysis figure 3 (red curve, area under curve AUC=0.834), the optimal cumulative predicted score was >10, a cut-off that predicted future HGD/EAC with a sensitivity of 84% and a specificity of 67%.
Multivariate logistic regression analysis to assess the independent significance of various clinicopathological parameters for progression to advanced neoplasia
Analysis of p53 expression in NDBE biopsies at 1-year, 3-year and 5-year intervals (between index NDBE biopsy and index diagnosis of dysplasia)
The mean number of 3+p53 positive columnar cells, 3+p53 positive glands, ≥10 3+ p53 positive cells, 3+p53 positive surface epithelial cells and abnormal p53 stain (higher in the prevalent dysplasia group compared with incidental dysplasia (p=NS) (table 5). An abnormal p53 stain was identified in 54% of cases in the prevalent dysplasia group. The p53 immunohistochemical assay was abnormal in 55.1% and 55.6% of NDBE biopsies when the data was analysed at 3-year and 5-year surveillance intervals, respectively.
Comparison of p53 expression in NDBE biopsies at 1-year, 3-year and 5-year intervals between an index NDBE biopsy and advanced dysplasia diagnosis
Correlation of automated and manual p53 analysis
We also assessed the ability of two observers to identify the population with ≥10 3+ p53 positive columnar cells using routine microscopy. There was a strong correlation between the automated and manual assessment (Cohen’s kappa=0.743, Pearson’s correlation <0.0001), suggesting that the assay could be adapted to routine clinical practice using light microscopy.
Evaluation of p53 expression in the secondary cohort
Finally, we validated these results on a multi-institutional cohort of NDBE biopsies from patients who eventually progressed to advanced dysplasia. This cohort was composed of 30 patients, and the most advanced dysplasia was HGD (55.6%) in 25 patients, and EAC in 5 (11.1%) patients. Overall, there was male predominance (M=83%, F=17%) with a mean age of 65 years (range: 38–81 years). NDBE biopsies in 12 (40%) patients showed ≥10 3+ p53 positive columnar cells, a number comparable with the 39% patients identified in the primary series (online supplemental table 4).
We also calculated cumulative prediction scores in the secondary cohort. Twenty-four cases had all five parameters age, gender, length of BE, ≥10 3+ p53 positive columnar cells,and ≥1 3+ p53 positive glands for analysis. Of the 24 patients, 22 had a prediction score of >10 (mean score: 14.6), yielding a sensitivity of 83.3%.
Eighteen of 30 patients had prevalent dysplasia (60%) in the secondary cohort, a number significantly higher than our primary cohort. The comparison of p53 expression between biopsies with prevalent and incidental dysplasia in the secondary cohort yielded a very similar trend compared with the primary cohort; however, these results did not achieve statistical significance (online supplemental table 5).
Discussion
The incidence of EAC is among the fastest rising cancers in the USA, and the prognosis of newly diagnosed cases in all but intramucosal lesions ranges from very poor to dismal.15 The current generic approach to the screening of BE patients for neoplasia has many challenges, including the lack of ancillary discriminative tests for risk stratification. Detecting dysplasia that develops within 3 and 5 years of the index non-dysplastic biopsy could individualise surveillance protocols. Our data suggest that approximately one-half of patients with prevalent neoplasia could be identified based on a single p53 immunohistochemical analysis of non-dysplastic biopsy and interpreted by an automated platform. We believe that this ability of p53 to detect prevalent dysplasia is based on three recognised paradigms: (1) advanced neoplasia may be endoscopically invisible and random biopsies may fail to sample the neoplasm, (2) immunohistochemistry for p53 is a powerful surrogate marker for TP53 mutations and (3) TP53 mutations are virtually identified in all advanced BE-related neoplasia cases, a genetic abnormality that is detected in both foci with advanced neoplasia and adjacent NDBE.
In this study, we use a 30-year longitudinal cohort that represents all patients with oesophageal biopsies seen at a single large academic centre in the Northeastern region of USA. We classified BE patients into progressor and NP groups based on whether they developed HGD/EAC or not. The inability to distinguish progressors from NP with high reliability based on p53 analysis of non-dysplastic biopsies by light microscopy led us to a computational approach using whole slide imaging, a methodology that is increasingly available in clinical laboratories across the country. In the second portion of the analysis, we employed thresholds derived from this quantitative approach to assess NDBE biopsies from a set of progressor patients collated from four academic institutions.
The data call for the following observations and conclusions: (1) an automated analysis of p53 immunohistochemical stain distinguishes progressors from NP with a specificity and sensitivity of 93% and 39% respectively, a performance significantly better than prior attempts to identify progressors, (2) an abnormal p53 stain could be identified in 54% of NDBE biopsies from patients with prevalent neoplasia, (3) the assay could detect 55% and 56% of cases where the time interval between NDBE biopsy and index dysplastic biopsy was 3 and 5 years, respectively. Of note, while prior studies identified strong staining in glandular units as a predictor of advanced neoplasia in patients with BE, the current study highlights the predictive value of scattered strongly positive cells as well, as derived from our quantitative analysis.
Positive p53 immunostaining has proven to be the most promising biomarker for supporting a diagnosis of dysplasia, and hence can be used as a tool to predict development of dysplasia in patients with NDBE. However, in spite of the widespread consensus on the predictive value of p53 immunohistochemistry, such testing on all BE biopsies has not been implemented in the clinical laboratories or recommended by ACG (American College of Gastroenterology).2 We believe that one of the limitations of the existing data is the inability to define the appropriate cut-offs that could identify patients at the highest risk of developing neoplasia.
Prior studies demonstrated a strong and significant association between aberrant p53 immunostaining and progression to HGD/EAC. However, the scoring of p53 immunostain in the context of assessing neoplastic progression has been subjective and semiquantitative. For instance, in a population-based longitudinal study consisting of 34 cases that developed EAC (‘progressors’) and 163 controls (‘NP’), NDBE biopsies with 2+ (10%–50% positive cells; diffuse staining) or 3+ (>50% positive cells or confluent groups of positively stained glands; intense staining) showed a strong association with progression to HGD/EAC with an OR of 6.34.16 However, the sensitivity and specificity of p53 in predicting progression was 32% and 64%, respectively.
A recent study by Redston et al analysed abnormal p53 expression in a retrospective cohort of 358 NDBE and a prospectively validated cohort of 646 NDBE biopsies. p53 expression was assessed by a semiquantitative method (1+, 2+ and 3+staining) and positivity was defined when >50% crypt epithelial cells show 2/3+ staining in at least one crypt or glandular profile, or within a contiguous focus of at least 20 surface epithelial cells. Abnormal p53 immunostaining strongly correlated with p53 mutational status and predicted neoplastic progression in retrospective as well as validation cohort. The authors supported utility of a p53 IHC stain along with histological analysis and suggested a repeat yearly surveillance in NDBE cases with abnormal p53 stain.17 Two other prior studies by Hadjinicolaou et al 18 and Kastelein et al 19 specifically focused on p53 expression in NDBE samples and reported that p53 expression (defined either as intense/strong expression or loss of expression) in NDBE biopsies ranges from 7% to 19% among NP and 18% to 33% among progressors. In the study by Hadjinicolaou et al, aberrant p53 staining was noted in 14/74 (19%) NP and 8/23 (33%) progressors.18 Aberrant p53 expression was found to be associated with a risk of short-term progression (OR 6.0, 95% CI 3.1 to 11.2). Based on these observations, the authors conclude that aberrant p53 expression in NDBE biopsies indicates prevalent dysplasia, which may have been missed by random biopsies. In a systematic review and meta-analysis, approximately 80.5% of adenocarcinomas and cases with HGD were classified as prevalent, implying that advanced neoplasia was likely present at the time of the index biopsy in 4 in 5 cases of NDBE patients.20 In our study, abnormal p53 immunohistochemical staining pattern in non-dysplastic mucosa stain could identify 54% of patients with unsampled advanced prevalent BE-related neoplasia.
Our study has several strengths including the large cohort of patients with BE, the largest on record and long follow-up time. The diagnosis of dysplasia was validated by at least two GI pathologists with expertise in the field. In contrast to the previous studies, the slides were not only evaluated semiquantitatively, but also by using an objective quantitative platform. It is notable that this is the first attempt to quantitate p53 stain. This study has some limitations worthy of note; the most significant limitation is that this is not a population-based study and is associated with selection biases, and thus it is unclear if the results could be generalised to the community. Although we cannot evaluate p53 immunohistochemistry as a tool to predict advanced neoplasia, the stain is effective in identifying approximately half of all cases that would be categorised as prevalent HGD/EAC. We would posit that the current study resembles a population-based study in that the institution is a large general hospital and the requirement of a prior NDBE biopsy limited referral bias. Additional limitations include the retrospective nature of the study and the lack of stringent follow-up scheme. However, the fact that the biopsies were collected under the varied protocols, typical of current practice in the community, approximates the scenario encountered in current clinical practice and makes this relevant to a broad range of academic medical centres. Regardless, the retrospective nature of the study design does not allow us to establish precise time points for performing p53 during the surveillance period. Finally, although we attempted to match the two groups, given that we preferentially included cases with the longest follow-up, the cohorts were not matched with respect to age, sex and BE length. This, however, allowed for the development of a model to predict progression based on age, gender, length of BE and p53 with a sensitivity of 84% and specificity of 67%.
In conclusion, immunohistochemical detection of abnormal p53 in NDBE biopsies as a biomarker of neoplastic progression can be performed via an automated platform, although the sensitivity for cancer risk is lower than one that can be recommended for it to be applied as a single criterion for endoscopic surveillance. Nevertheless, the stain could identify a subgroup of patients with NDBE biopsies who are at an increased risk of prevalent neoplasia and could benefit from early screening, preferably within 1 year of the index endoscopy. Whether p53 immunostain should be performed on all NDBE biopsies remains an open question. While our data certainly support additional sampling in patients with NDBE and abnormal p53, it is important to integrate other clinical factors, such as age, gender and BE length while planing intensified surveillance for these patients. Estimating the sensitivity of the quantitative p53 assay for predicting advanced neoplasia would require a population-based study. Additionally, whether the sensitivity would be enhanced by the analysis of multiple biopsies would require further study. Surveillance of such a small high-risk group may eventually result in lower costs of surveillance, less burden on endoscopy units, and higher quality of life for patients with BE.
Data availability statement
Data are available on reasonable request. Data, analytical methods and study materials will be made available to other researchers on request.
Ethics statements
Patient consent for publication
References
Supplementary materials
Supplementary Data
This web only file has been produced by the BMJ Publishing Group from an electronic file supplied by the author(s) and has not been edited for content.
Footnotes
DTP and VD contributed equally.
Contributors AN: conceptualisation, sample collection, data curation, data analysis, methodology, original draft writing, review and editing, SR: conceptualisation, data curation, methodology, OY: resources, review and editing, PP: data curation, CL: data analysis, methodology, automated image analysis software support, OY: sample and data collection, EYW: sample and data collection, W-TC: sample and data collection, MG: conceptualisation, data curation, original draft writing, DTT: conceptualisation, data curation, data analysis, methodology, resources, original draft writing, RO: supervision, conceptualisation, data curation, data analysis, methodology, original draft writing, DP: supervision, conceptualisation, data curation, data analysis, original draft writing, review and editing, VD: supervision, conceptualisation, data curation, data analysis, original draft writing, review and editing. All authors: final approval of the manuscript. DP and VD are joint last authors, Guarantor of the manuscript: VD.
Funding The authors have not declared a specific grant for this research from any funding agency in the public, commercial or not-for-profit sectors.
Competing interests None declared.
Provenance and peer review Not commissioned; externally peer reviewed.
Supplemental material This content has been supplied by the author(s). It has not been vetted by BMJ Publishing Group Limited (BMJ) and may not have been peer-reviewed. Any opinions or recommendations discussed are solely those of the author(s) and are not endorsed by BMJ. BMJ disclaims all liability and responsibility arising from any reliance placed on the content. Where the content includes any translated material, BMJ does not warrant the accuracy and reliability of the translations (including but not limited to local regulations, clinical guidelines, terminology, drug names and drug dosages), and is not responsible for any error and/or omissions arising from translation and adaptation or otherwise.